Hallöchen zusammen,
ich habe seit einiger Zeit immermal wieder das Problem, dass sich mein Windows aufhängt bzw. nach einiger Zeit dann auch mit Bluescreen verabschiedet.
In der letzten Nacht sogar zwei Mal. Hab von beiden mal die Dumps analysieren lassen und hoffe, dass ihr mir weiterhelfen könnt.
.gif "sm_B-) :-)")
*******************************************************************************
* *
* Bugcheck Analysis *
* *
*******************************************************************************
SYSTEM_THREAD_EXCEPTION_NOT_HANDLED_M (1000007e)
This is a very common bugcheck. Usually the exception address pinpoints
the driver/function that caused the problem. Always note this address
as well as the link date of the driver/image that contains this address.
Some common problems are exception code 0x80000003. This means a hard
coded breakpoint or assertion was hit, but this system was booted
/NODEBUG. This is not supposed to happen as developers should never have
hardcoded breakpoints in retail code, but ...
If this happens, make sure a debugger gets connected, and the
system is booted /DEBUG. This will let us see why this breakpoint is
happening.
Arguments:
Arg1: ffffffffc0000005, The exception code that was not handled
Arg2: fffff800023c6df2, The address that the exception occurred at
Arg3: fffff880025556e8, Exception Record Address
Arg4: fffff88002554f40, Context Record Address
Debugging Details:
------------------
EXCEPTION_CODE: (NTSTATUS) 0xc0000005 - Die Anweisung in 0x%08lx verweist auf Speicher 0x%08lx. Der Vorgang %s konnte nicht im Speicher durchgef hrt werden.
FAULTING_IP:
nt!ExAllocatePoolWithTag+1e2
fffff800`023c6df2 1048c7 adc byte ptr [rax-39h],cl
EXCEPTION_RECORD: fffff880025556e8 -- (.exr 0xfffff880025556e8)
ExceptionAddress: fffff800023c6df2 (nt!ExAllocatePoolWithTag+0x00000000000001e2)
ExceptionCode: c0000005 (Access violation)
ExceptionFlags: 00000000
NumberParameters: 2
Parameter[0]: 0000000000000001
Parameter[1]: 0000000065576d14
Attempt to write to address 0000000065576d14
CONTEXT: fffff88002554f40 -- (.cxr 0xfffff88002554f40)
rax=0000000065576d4d rbx=fffffa801c6ee7c0 rcx=00000000000007ff
rdx=0000000000000322 rsi=fffffa80189bd000 rdi=0000000000000000
rip=fffff800023c6df2 rsp=fffff88002555920 rbp=0000000000007d50
r8=0000000000000801 r9=fffff80002422ef0 r10=fffff80002422588
r11=000000000000004b r12=fffffffffffee330 r13=0000000000000322
r14=0000000000000000 r15=0000000065576d4d
iopl=0 nv up ei pl zr na po nc
cs=0010 ss=0018 ds=002b es=002b fs=0053 gs=002b efl=00010246
nt!ExAllocatePoolWithTag+0x1e2:
fffff800`023c6df2 1048c7 adc byte ptr [rax-39h],cl ds:002b:00000000`65576d14=??
Resetting default scope
CUSTOMER_CRASH_COUNT: 1
DEFAULT_BUCKET_ID: CODE_CORRUPTION
PROCESS_NAME: System
CURRENT_IRQL: 0
ERROR_CODE: (NTSTATUS) 0xc0000005 - Die Anweisung in 0x%08lx verweist auf Speicher 0x%08lx. Der Vorgang %s konnte nicht im Speicher durchgef hrt werden.
EXCEPTION_PARAMETER1: 0000000000000001
EXCEPTION_PARAMETER2: 0000000065576d14
WRITE_ADDRESS: GetPointerFromAddress: unable to read from fffff800024ca100
GetUlongFromAddress: unable to read from fffff800024ca1c0
0000000065576d14 Nonpaged pool
FOLLOWUP_IP:
nt!ExAllocatePoolWithTag+1e2
fffff800`023c6df2 1048c7 adc byte ptr [rax-39h],cl
BUGCHECK_STR: 0x7E
LAST_CONTROL_TRANSFER: from fffff800022cb2da to fffff800023c6df2
STACK_TEXT:
fffff880`02555920 fffff800`022cb2da : 00000005`00000000 00000005`f78eb8c0 00000000`0069bbfc 00000000`000007ff : nt!ExAllocatePoolWithTag+0x1e2
fffff880`02555a10 fffff800`022cb9c0 : 00000000`00000000 fffffa80`1919a1b0 fffffa80`00000000 fffff8a0`0f1c5018 : nt!MiGatherMappedPages+0x4ca
fffff880`02555b10 fffff800`0252f2ea : fffffa80`18b5b1a0 00000000`00000080 fffffa80`18b359e0 c1393bdc`61a7cd0e : nt!MiMappedPageWriter+0x198
fffff880`02555c00 fffff800`022838e6 : fffff800`0240de80 fffffa80`18b5b1a0 fffff800`0241bcc0 5a28c03d`bbb090ec : nt!PspSystemThreadStartup+0x5a
fffff880`02555c40 00000000`00000000 : fffff880`02556000 fffff880`02550000 fffff880`02555790 00000000`00000000 : nt!KxStartSystemThread+0x16
CHKIMG_EXTENSION: !chkimg -lo 50 -d !nt
fffff800023c6df0 - nt!ExAllocatePoolWithTag+1e0
[ 8d:cd ]
1 error : !nt (fffff800023c6df0)
MODULE_NAME: memory_corruption
IMAGE_NAME: memory_corruption
FOLLOWUP_NAME: memory_corruption
DEBUG_FLR_IMAGE_TIMESTAMP: 0
MEMORY_CORRUPTOR: ONE_BIT
STACK_COMMAND: .cxr 0xfffff88002554f40 ; kb
FAILURE_BUCKET_ID: X64_MEMORY_CORRUPTION_ONE_BIT
BUCKET_ID: X64_MEMORY_CORRUPTION_ONE_BIT
Followup: memory_corruption
---------
*******************************************************************************
* *
* Bugcheck Analysis *
* *
*******************************************************************************
SYSTEM_SERVICE_EXCEPTION (3b)
An exception happened while executing a system service routine.
Arguments:
Arg1: 00000000c0000005, Exception code that caused the bugcheck
Arg2: fffff800025b6c12, Address of the instruction which caused the bugcheck
Arg3: fffff8801b8c3090, Address of the context record for the exception that caused the bugcheck
Arg4: 0000000000000000, zero.
Debugging Details:
------------------
EXCEPTION_CODE: (NTSTATUS) 0xc0000005 - Die Anweisung in 0x%08lx verweist auf Speicher 0x%08lx. Der Vorgang %s konnte nicht im Speicher durchgef hrt werden.
FAULTING_IP:
nt!NtWaitForSingleObject+b2
fffff800`025b6c12 488b4820 mov rcx,qword ptr [rax+20h]
CONTEXT: fffff8801b8c3090 -- (.cxr 0xfffff8801b8c3090)
rax=0000000000000000 rbx=fffffa801daaaa60 rcx=fffff80002472b80
rdx=0000000000000000 rsi=fffff8801b8c3ab8 rdi=0000000000000000
rip=fffff800025b6c12 rsp=fffff8801b8c3a70 rbp=fffff8801b8c3b60
r8=fffff8a00b7af000 r9=0000000000000008 r10=0000000000000000
r11=00000000001f0003 r12=0000000000000001 r13=0000000000000000
r14=000000000008ec80 r15=0000000071a92450
iopl=0 nv up ei pl zr na po nc
cs=0010 ss=0018 ds=002b es=002b fs=0053 gs=002b efl=00210246
nt!NtWaitForSingleObject+0xb2:
fffff800`025b6c12 488b4820 mov rcx,qword ptr [rax+20h] ds:002b:00000000`00000020=????????????????
Resetting default scope
CUSTOMER_CRASH_COUNT: 1
DEFAULT_BUCKET_ID: WIN7_DRIVER_FAULT
BUGCHECK_STR: 0x3B
PROCESS_NAME: qip.exe
CURRENT_IRQL: 0
LAST_CONTROL_TRANSFER: from fffff800022bfe53 to fffff800025b6c12
STACK_TEXT:
fffff880`1b8c3a70 fffff800`022bfe53 : fffffa80`1dae5060 00000000`000005f4 fffff880`1b8c3ab8 fffffa80`1daaaa60 : nt!NtWaitForSingleObject+0xb2
fffff880`1b8c3ae0 00000000`71a92e09 : 00000000`00000000 00000000`00000000 00000000`00000000 00000000`00000000 : nt!KiSystemServiceCopyEnd+0x13
00000000`0008ec08 00000000`00000000 : 00000000`00000000 00000000`00000000 00000000`00000000 00000000`00000000 : 0x71a92e09
FOLLOWUP_IP:
nt!NtWaitForSingleObject+b2
fffff800`025b6c12 488b4820 mov rcx,qword ptr [rax+20h]
SYMBOL_STACK_INDEX: 0
SYMBOL_NAME: nt!NtWaitForSingleObject+b2
FOLLOWUP_NAME: MachineOwner
MODULE_NAME: nt
IMAGE_NAME: ntkrnlmp.exe
DEBUG_FLR_IMAGE_TIMESTAMP: 521ea035
STACK_COMMAND: .cxr 0xfffff8801b8c3090 ; kb
FAILURE_BUCKET_ID: X64_0x3B_nt!NtWaitForSingleObject+b2
BUCKET_ID: X64_0x3B_nt!NtWaitForSingleObject+b2
Followup: MachineOwner
---------
Memtest lief 12 Stunden durch und hatte nichts gefunden.. Die "qip.exe" .. QIP ist ein Multi-Messenger Programm.
Falls weitere Infos benötigt werden, einfach bescheid sagen. ^^
Danke schon mal im Voraus für die Hilfe.

Edit: Gerade eben einen weiteren Bluescreen gehabt... Hier die Auswertung:
*******************************************************************************
* *
* Bugcheck Analysis *
* *
*******************************************************************************
IRQL_NOT_LESS_OR_EQUAL (a)
An attempt was made to access a pageable (or completely invalid) address at an
interrupt request level (IRQL) that is too high. This is usually
caused by drivers using improper addresses.
If a kernel debugger is available get the stack backtrace.
Arguments:
Arg1: 000000001961e9c0, memory referenced
Arg2: 0000000000000002, IRQL
Arg3: 0000000000000001, bitfield :
bit 0 : value 0 = read operation, 1 = write operation
bit 3 : value 0 = not an execute operation, 1 = execute operation (only on chips which support this level of status)
Arg4: fffff8000229b93c, address which referenced memory
Debugging Details:
------------------
WRITE_ADDRESS: GetPointerFromAddress: unable to read from fffff800024cc100
GetUlongFromAddress: unable to read from fffff800024cc1c0
000000001961e9c0 Nonpaged pool
CURRENT_IRQL: 2
FAULTING_IP:
nt!KeWaitForSingleObject+13c
fffff800`0229b93c f00fba2e07 lock bts dword ptr [rsi],7
CUSTOMER_CRASH_COUNT: 1
DEFAULT_BUCKET_ID: CODE_CORRUPTION
BUGCHECK_STR: 0xA
PROCESS_NAME: Skype.exe
TRAP_FRAME: fffff8801b8bd6a0 -- (.trap 0xfffff8801b8bd6a0)
NOTE: The trap frame does not contain all registers.
Some register values may be zeroed or incorrect.
rax=92c54ffde8f2d5c0 rbx=0000000000000000 rcx=0000000000000011
rdx=0000000000000033 rsi=0000000000000000 rdi=0000000000000000
rip=fffff8000229b93c rsp=fffff8801b8bd830 rbp=0000000000000000
r8=fffff78000000008 r9=0000000000000000 r10=48d0b60f45034c77
r11=fffff88002149180 r12=0000000000000000 r13=0000000000000000
r14=0000000000000000 r15=0000000000000000
iopl=0 nv up ei pl nz na po cy
nt!KeWaitForSingleObject+0x13c:
fffff800`0229b93c f00fba2e07 lock bts dword ptr [rsi],7 ds:00000000`00000000=????????
Resetting default scope
LAST_CONTROL_TRANSFER: from fffff80002294169 to fffff80002294bc0
STACK_TEXT:
fffff880`1b8bd558 fffff800`02294169 : 00000000`0000000a 00000000`1961e9c0 00000000`00000002 00000000`00000001 : nt!KeBugCheckEx
fffff880`1b8bd560 fffff800`02292de0 : 00000000`00000000 00000000`00000000 00000000`00000000 0000000a`d8030860 : nt!KiBugCheckDispatch+0x69
fffff880`1b8bd6a0 fffff800`0229b93c : fffff900`00000004 fffff960`00000000 fffff900`c0619010 fffff880`1b8bdb60 : nt!KiPageFault+0x260
fffff880`1b8bd830 fffff800`02274b4e : fffffa80`1b928300 00000000`0000001b 00000000`00000000 fffff880`02149100 : nt!KeWaitForSingleObject+0x13c
fffff880`1b8bd8d0 fffff800`02299dbc : ffffffff`ffb3b4c0 fffffa80`1961e9c0 fffffa80`1b928320 fffff800`0240fe80 : nt!ExpWaitForResource+0xae
fffff880`1b8bd940 fffff800`0229da53 : 00000000`0ba7fd20 fffffa80`1e552060 fffff880`1b8bdb60 00000000`00000006 : nt!ExAcquireResourceExclusiveLite+0x14f
fffff880`1b8bd9b0 fffff960`000c4af1 : 00000000`00000000 00000000`00000000 00000000`00000000 fffff780`00000008 : nt!ExEnterPriorityRegionAndAcquireResourceExclusive+0x23
fffff880`1b8bd9e0 fffff800`02293e53 : fffffa80`1e552060 00000000`0ba7e098 fffff880`1b8bda88 00000000`7ef1a000 : win32k!NtUserPeekMessage+0x31
fffff880`1b8bda70 00000000`71fdfdea : 00000000`00000000 00000000`00000000 00000000`00000000 00000000`00000000 : nt!KiSystemServiceCopyEnd+0x13
00000000`0ba7e078 00000000`00000000 : 00000000`00000000 00000000`00000000 00000000`00000000 00000000`00000000 : 0x71fdfdea
STACK_COMMAND: kb
CHKIMG_EXTENSION: !chkimg -lo 50 -d !nt
fffff8000229b831 - nt!KeWaitForSingleObject+31
[ 0f:4f ]
1 error : !nt (fffff8000229b831)
MODULE_NAME: memory_corruption
IMAGE_NAME: memory_corruption
FOLLOWUP_NAME: memory_corruption
DEBUG_FLR_IMAGE_TIMESTAMP: 0
MEMORY_CORRUPTOR: ONE_BIT
FAILURE_BUCKET_ID: X64_MEMORY_CORRUPTION_ONE_BIT
BUCKET_ID: X64_MEMORY_CORRUPTION_ONE_BIT
Followup: memory_corruption
---------
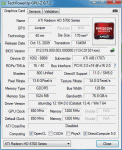 GPU GC.gif24 KB · Aufrufe: 70
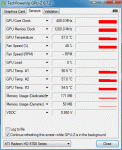 GPU S.gif16,7 KB · Aufrufe: 69
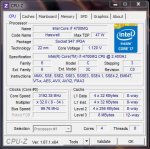
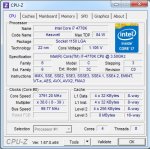
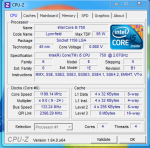 CPU CPU.png64,2 KB · Aufrufe: 81
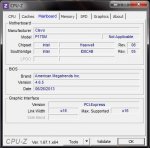
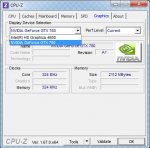
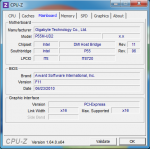 CPU Main.png39,9 KB · Aufrufe: 64
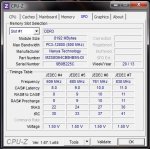
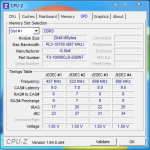 CPU SPD 1.png45,9 KB · Aufrufe: 66
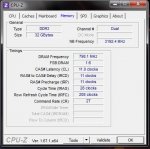
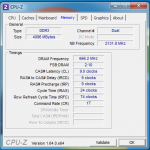 CPU Memory.png42,6 KB · Aufrufe: 65
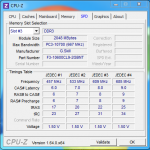 CPU SPD 3.png50,2 KB · Aufrufe: 62
 CDI Data.png130,1 KB · Aufrufe: 66
 CDI SSD System.png106,1 KB · Aufrufe: 67