R4Z0R1911
BIOS-Overclocker(in)
Guten Abend liebe Community,
guten Abend simpel1970,
ich habe Anfang Dez 2012 ein Komplettsystem (selbst konfiguriert und zusammenbauen lassen), welches bereits 1x zur Reklamation zurückgeschickt wurde. Bei der Reklamation wurden NT/MoBo & Graka ausgetauscht, da das Netzteil defekt war!!! Nun bekam ich das System vor kurzem zurück und musste nach der Reparatur erneut Mängel feststellen => Bluescreens und eine SSD mit 3gb/s ausgehandelter Geschwindigkeit..
Kurz daraufhin die Hotline des Unternehmens kontaktiert, wurde mir empfohlen ich soll das SATA Kabel in den SATA3 (6 GB/S) Slot einsetzen und Windows neuinstallieren, da durch den Falschanschluss
die Bluescreens entstanden wären, obwohl sie die Minidumps des Bluescreens nicht mal angeschaut haben.
Den Rat des Technikers befolgt und Windows 7 64bit HP erneut installiert, funktionierte die SSD endlich mit 6gb/s, dennoch hatte ich am selben Abend wieder einen Bluescreen. Bis
jetzt hatte ich nur einen Bluescreen, die restlichen kann ich nur fotografisch vorweisen.
Ich hoffe Ihr könnt mir helfen bzw. mitteilen wo der Fehler liegt...
Freundliche Grüße
Mali762
Im Anhang befindet sich ein WinZip-Archiv bestehend aus:
Bilder meiner Bluescreens
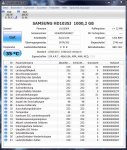
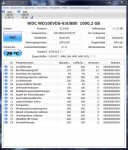
Screenshots von CPU-Z
Minidump-Datei
Minidump Anaylze:
Microsoft (R) Windows Debugger Version 6.4.0007.2
Copyright (c) Microsoft Corporation. All rights reserved.
Loading Dump File [C:\Windows\Minidump\010413-11060-01.dmp]
Mini Kernel Dump File: Only registers and stack trace are available
Symbol search path is: SRV*C:Symbols*http://msdl.microsoft.com/download/symbols
Executable search path is:
Windows Longhorn Kernel Version 7601 (Service Pack 1) MP (12 procs) Free x64
Product: WinNt, suite: TerminalServer SingleUserTS Personal
Built by: 7601.17944.amd64fre.win7sp1_gdr.120830-0333
Kernel base = 0xfffff800`02e0a000 PsLoadedModuleList = 0xfffff800`0304e670
Debug session time: Fri Jan 4 23:20:15.992 2013 (GMT+1)
System Uptime: 0 days 0:10:32.835
Loading Kernel Symbols
...........................................................................................................................................................
Loading unloaded module list
....
Loading User Symbols
*******************************************************************************
* *
* Bugcheck Analysis *
* *
*******************************************************************************
Use !analyze -v to get detailed debugging information.
BugCheck 7F, {8, 80050031, 406f8, fffff88007c1efba}
Unable to load image \SystemRoot\system32\DRIVERS\nvlddmkm.sys, Win32 error 2
*** WARNING: Unable to verify timestamp for nvlddmkm.sys
*** ERROR: Module load completed but symbols could not be loaded for nvlddmkm.sys
Probably caused by : nvlddmkm.sys ( nvlddmkm+1d2fba )
Followup: MachineOwner
---------
9: kd> !analyze -v
*******************************************************************************
* *
* Bugcheck Analysis *
* *
*******************************************************************************
UNEXPECTED_KERNEL_MODE_TRAP (7f)
This means a trap occurred in kernel mode, and it's a trap of a kind
that the kernel isn't allowed to have/catch (bound trap) or that
is always instant death (double fault). The first number in the
bugcheck params is the number of the trap (8 = double fault, etc)
Consult an Intel x86 family manual to learn more about what these
traps are. Here is a *portion* of those codes:
If kv shows a taskGate
use .tss on the part before the colon, then kv.
Else if kv shows a trapframe
use .trap on that value
Else
.trap on the appropriate frame will show where the trap was taken
(on x86, this will be the ebp that goes with the procedure KiTrap)
Endif
kb will then show the corrected stack.
Arguments:
Arg1: 0000000000000008, EXCEPTION_DOUBLE_FAULT
Arg2: 0000000080050031
Arg3: 00000000000406f8
Arg4: fffff88007c1efba
Debugging Details:
------------------
BUGCHECK_STR: 0x7f_8
CUSTOMER_CRASH_COUNT: 1
DEFAULT_BUCKET_ID: DRIVER_FAULT
CURRENT_IRQL: 2
LAST_CONTROL_TRANSFER: from fffff80002e88569 to fffff80002e88fc0
STACK_TEXT:
fffff880`0645dee8 fffff800`02e88569 : 00000000`0000007f 00000000`00000008 00000000`80050031 00000000`000406f8 : nt!KeBugCheckEx
fffff880`0645def0 fffff800`02e86a32 : 00000000`00000000 00000000`00000000 00000000`00000000 00000000`00000000 : nt!KiBugCheckDispatch+0x69
fffff880`0645e030 fffff880`07c1efba : 00000000`00000000 00000000`00000000 fffffa80`12a90920 00000000`00000000 : nt!KiDoubleFaultAbort+0xb2
fffff880`0647a000 00000000`00000000 : 00000000`00000000 fffffa80`12a90920 00000000`00000000 fffff880`0647a080 : nvlddmkm+0x1d2fba
fffff880`0647a008 00000000`00000000 : fffffa80`12a90920 00000000`00000000 fffff880`0647a080 fffff880`07c1efbf : 0x0
fffff880`0647a010 fffffa80`12a90920 : 00000000`00000000 fffff880`0647a080 fffff880`07c1efbf fffffa80`1292f000 : 0x0
fffff880`0647a018 00000000`00000000 : fffff880`0647a080 fffff880`07c1efbf fffffa80`1292f000 00000000`00088480 : 0xfffffa80`12a90920
fffff880`0647a020 fffff880`0647a080 : fffff880`07c1efbf fffffa80`1292f000 00000000`00088480 fffff880`0647a0f0 : 0x0
fffff880`0647a028 fffff880`07c1efbf : fffffa80`1292f000 00000000`00088480 fffff880`0647a0f0 00000000`00000000 : 0xfffff880`0647a080
fffff880`0647a030 fffffa80`1292f000 : 00000000`00088480 fffff880`0647a0f0 00000000`00000000 fffff880`0647a080 : nvlddmkm+0x1d2fbf
fffff880`0647a038 00000000`00088480 : fffff880`0647a0f0 00000000`00000000 fffff880`0647a080 fffff880`07c1f11b : 0xfffffa80`1292f000
fffff880`0647a040 fffff880`0647a0f0 : 00000000`00000000 fffff880`0647a080 fffff880`07c1f11b 00000000`00000000 : 0x88480
fffff880`0647a048 00000000`00000000 : fffff880`0647a080 fffff880`07c1f11b 00000000`00000000 00000000`00001100 : 0xfffff880`0647a0f0
fffff880`0647a050 fffff880`0647a080 : fffff880`07c1f11b 00000000`00000000 00000000`00001100 fffff880`0647a120 : 0x0
fffff880`0647a058 fffff880`07c1f11b : 00000000`00000000 00000000`00001100 fffff880`0647a120 00000000`00000000 : 0xfffff880`0647a080
fffff880`0647a060 00000000`00000000 : 00000000`00001100 fffff880`0647a120 00000000`00000000 fffff880`0647a0e0 : nvlddmkm+0x1d311b
fffff880`0647a068 00000000`00001100 : fffff880`0647a120 00000000`00000000 fffff880`0647a0e0 fffff880`07c5276a : 0x0
fffff880`0647a070 fffff880`0647a120 : 00000000`00000000 fffff880`0647a0e0 fffff880`07c5276a fffffa80`0c788230 : 0x1100
fffff880`0647a078 00000000`00000000 : fffff880`0647a0e0 fffff880`07c5276a fffffa80`0c788230 fffff880`064621c0 : 0xfffff880`0647a120
fffff880`0647a080 fffff880`0647a0e0 : fffff880`07c5276a fffffa80`0c788230 fffff880`064621c0 00000000`00088480 : 0x0
fffff880`0647a088 fffff880`07c5276a : fffffa80`0c788230 fffff880`064621c0 00000000`00088480 fffff880`0647f9a0 : 0xfffff880`0647a0e0
fffff880`0647a090 fffffa80`0c788230 : fffff880`064621c0 00000000`00088480 fffff880`0647f9a0 fffff880`0647a0e0 : nvlddmkm+0x20676a
fffff880`0647a098 fffff880`064621c0 : 00000000`00088480 fffff880`0647f9a0 fffff880`0647a0e0 fffff880`07bfd343 : 0xfffffa80`0c788230
fffff880`0647a0a0 00000000`00088480 : fffff880`0647f9a0 fffff880`0647a0e0 fffff880`07bfd343 fffffa80`12a90920 : 0xfffff880`064621c0
fffff880`0647a0a8 fffff880`0647f9a0 : fffff880`0647a0e0 fffff880`07bfd343 fffffa80`12a90920 00000000`00000000 : 0x88480
fffff880`0647a0b0 fffff880`0647a0e0 : fffff880`07bfd343 fffffa80`12a90920 00000000`00000000 00000000`00000100 : 0xfffff880`0647f9a0
fffff880`0647a0b8 fffff880`07bfd343 : fffffa80`12a90920 00000000`00000000 00000000`00000100 00000000`00088480 : 0xfffff880`0647a0e0
fffff880`0647a0c0 fffffa80`12a90920 : 00000000`00000000 00000000`00000100 00000000`00088480 fffff880`0647a140 : nvlddmkm+0x1b1343
fffff880`0647a0c8 00000000`00000000 : 00000000`00000100 00000000`00088480 fffff880`0647a140 fffff880`07c4bd66 : 0xfffffa80`12a90920
fffff880`0647a0d0 00000000`00000100 : 00000000`00088480 fffff880`0647a140 fffff880`07c4bd66 fffffa80`1292f000 : 0x0
fffff880`0647a0d8 00000000`00088480 : fffff880`0647a140 fffff880`07c4bd66 fffffa80`1292f000 fffffa80`1292f000 : 0x100
fffff880`0647a0e0 fffff880`0647a140 : fffff880`07c4bd66 fffffa80`1292f000 fffffa80`1292f000 fffffa80`1292f370 : 0x88480
fffff880`0647a0e8 fffff880`07c4bd66 : fffffa80`1292f000 fffffa80`1292f000 fffffa80`1292f370 00000000`00001100 : 0xfffff880`0647a140
fffff880`0647a0f0 fffffa80`1292f000 : fffffa80`1292f000 fffffa80`1292f370 00000000`00001100 fffff880`0647a168 : nvlddmkm+0x1ffd66
fffff880`0647a0f8 fffffa80`1292f000 : fffffa80`1292f370 00000000`00001100 fffff880`0647a168 fffff880`07c4bda7 : 0xfffffa80`1292f000
fffff880`0647a100 fffffa80`1292f370 : 00000000`00001100 fffff880`0647a168 fffff880`07c4bda7 fffffa80`1292f000 : 0xfffffa80`1292f000
fffff880`0647a108 00000000`00001100 : fffff880`0647a168 fffff880`07c4bda7 fffffa80`1292f000 fffff880`0647a208 : 0xfffffa80`1292f370
fffff880`0647a110 fffff880`0647a168 : fffff880`07c4bda7 fffffa80`1292f000 fffff880`0647a208 fffffa80`129476c0 : 0x1100
fffff880`0647a118 fffff880`07c4bda7 : fffffa80`1292f000 fffff880`0647a208 fffffa80`129476c0 fffffa80`1292f000 : 0xfffff880`0647a168
fffff880`0647a120 fffffa80`1292f000 : fffff880`0647a208 fffffa80`129476c0 fffffa80`1292f000 fffff880`0647a170 : nvlddmkm+0x1ffda7
fffff880`0647a128 fffff880`0647a208 : fffffa80`129476c0 fffffa80`1292f000 fffff880`0647a170 fffff880`07dcf8c4 : 0xfffffa80`1292f000
fffff880`0647a130 fffffa80`129476c0 : fffffa80`1292f000 fffff880`0647a170 fffff880`07dcf8c4 fffffa80`00000000 : 0xfffff880`0647a208
fffff880`0647a138 fffffa80`1292f000 : fffff880`0647a170 fffff880`07dcf8c4 fffffa80`00000000 fffff880`0647a1e0 : 0xfffffa80`129476c0
fffff880`0647a140 fffff880`0647a170 : fffff880`07dcf8c4 fffffa80`00000000 fffff880`0647a1e0 fffffa80`129476c0 : 0xfffffa80`1292f000
fffff880`0647a148 fffff880`07dcf8c4 : fffffa80`00000000 fffff880`0647a1e0 fffffa80`129476c0 fffffa80`00000000 : 0xfffff880`0647a170
fffff880`0647a150 fffffa80`00000000 : fffff880`0647a1e0 fffffa80`129476c0 fffffa80`00000000 fffff880`0647a1c0 : nvlddmkm+0x3838c4
fffff880`0647a158 fffff880`0647a1e0 : fffffa80`129476c0 fffffa80`00000000 fffff880`0647a1c0 fffff880`07e10eae : 0xfffffa80`00000000
fffff880`0647a160 fffffa80`129476c0 : fffffa80`00000000 fffff880`0647a1c0 fffff880`07e10eae 00000000`00000004 : 0xfffff880`0647a1e0
fffff880`0647a168 fffffa80`00000000 : fffff880`0647a1c0 fffff880`07e10eae 00000000`00000004 00000000`8c0001fe : 0xfffffa80`129476c0
fffff880`0647a170 fffff880`0647a1c0 : fffff880`07e10eae 00000000`00000004 00000000`8c0001fe fffffa80`1295c900 : 0xfffffa80`00000000
FOLLOWUP_IP:
nvlddmkm+1d2fba
fffff880`07c1efba e8b511feff call nvlddmkm+0x1b4174 (fffff88007c00174)
SYMBOL_STACK_INDEX: 3
FOLLOWUP_NAME: MachineOwner
SYMBOL_NAME: nvlddmkm+1d2fba
MODULE_NAME: nvlddmkm
IMAGE_NAME: nvlddmkm.sys
DEBUG_FLR_IMAGE_TIMESTAMP: 50b97852
STACK_COMMAND: kb
FAILURE_BUCKET_ID: X64_0x7f_8_nvlddmkm+1d2fba
BUCKET_ID: X64_0x7f_8_nvlddmkm+1d2fba
Followup: MachineOwner
Schaue mal nach ob es Treiber Updates für deine Grafikkarte gibt, denn in deinem log wird mehrmals die nvlddmkm.sys aufgeführt.
Scheint also ein Treiber Problem zu sein.
Falls es kein Update geben sollte da du bereits die aktuellste Version benutzt versuche ein Downgrade oder eine Neuinstallation.
")

")
 rocessDeferredCommand+0x142