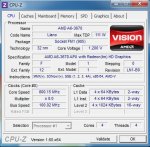
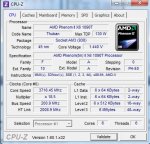
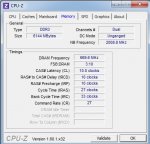
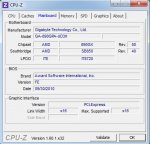
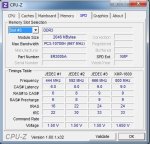
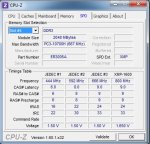
Hallo ich bin der Micha und wollte gerne wissen ob ihr mir bei meinem Problem helfen könnt ,habe einen neuen Rechner von Otto gekauft und habe jetzt andauernd Bluescreen habe jetzt die minidump ausgelesen und vieleicht könnt ihr mir sagen wo der fehler ist:
Microsoft (R) Windows Debugger Version 6.2.8229.0 AMD64
Copyright (c) Microsoft Corporation. All rights reserved.
Loading Dump File [C:\Windows\Minidump\042212-23805-01.dmp]
Mini Kernel Dump File: Only registers and stack trace are available
Symbol search path is: SRV*C:\symbols*
http://msdl.microsoft.com/download/symbols
Executable search path is:
Windows 7 Kernel Version 7601 (Service Pack 1) MP (4 procs) Free x64
Product: WinNt, suite: TerminalServer SingleUserTS Personal
Built by: 7601.17790.amd64fre.win7sp1_gdr.120305-1505
Machine Name:
Kernel base = 0xfffff800`02c5f000 PsLoadedModuleList = 0xfffff800`02ea3650
Debug session time: Sun Apr 22 13:16:50.934 2012 (UTC + 2:00)
System Uptime: 0 days 0:02:20.682
Loading Kernel Symbols
...............................................................
................................................................
.......................
Loading User Symbols
Loading unloaded module list
....
TRIAGER: Could not open triage file : C:\Program Files (x86)\Windows Kits\8.0\Debuggers\x64\triage\oca.ini, error 2
TRIAGER: Could not open triage file : C:\Program Files (x86)\Windows Kits\8.0\Debuggers\x64\winxp\triage.ini, error 2
*******************************************************************************
* *
* Bugcheck Analysis *
* *
*******************************************************************************
Use !analyze -v to get detailed debugging information.
BugCheck 101, {31, 0, fffff88003163180, 2}
Probably caused by : Unknown_Image ( ANALYSIS_INCONCLUSIVE )
Followup: MachineOwner
---------
0: kd> !analyze -v
*******************************************************************************
* *
* Bugcheck Analysis *
* *
*******************************************************************************
CLOCK_WATCHDOG_TIMEOUT (101)
An expected clock interrupt was not received on a secondary processor in an
MP system within the allocated interval. This indicates that the specified
processor is hung and not processing interrupts.
Arguments:
Arg1: 0000000000000031, Clock interrupt time out interval in nominal clock ticks.
Arg2: 0000000000000000, 0.
Arg3: fffff88003163180, The PRCB address of the hung processor.
Arg4: 0000000000000002, 0.
Debugging Details:
------------------
BUGCHECK_STR: CLOCK_WATCHDOG_TIMEOUT_4_PROC
CUSTOMER_CRASH_COUNT: 1
DEFAULT_BUCKET_ID: WIN7_DRIVER_FAULT
PROCESS_NAME: System
CURRENT_IRQL: d
STACK_TEXT:
fffff880`009a9768 fffff800`02d32a3a : 00000000`00000101 00000000`00000031 00000000`00000000 fffff880`03163180 : nt!KeBugCheckEx
fffff880`009a9770 fffff800`02ce57f7 : 00000000`00000000 fffff800`00000002 00000000`00002711 fffff800`02cdef43 : nt! ?? ::FNODOBFM::`string'+0x4e2e
fffff880`009a9800 fffff800`02c20895 : fffff800`02c46460 fffff880`009a99b0 fffff800`02c46460 00000000`00000000 : nt!KeUpdateSystemTime+0x377
fffff880`009a9900 fffff800`02cd81d3 : 00000000`edcdee77 fffff800`02e50e80 fffff800`02e50e80 00000000`00000010 : hal!HalpHpetClockInterrupt+0x8d
fffff880`009a9930 fffff800`02d11677 : fffff800`02e50e80 00000000`00000001 00000000`00000000 00000000`00000000 : nt!KiInterruptDispatchNoLock+0x163
fffff880`009a9ac0 fffff800`02ce0b0c : 00000000`00000000 fffff880`009a9bf8 00000000`00000000 00000000`00000000 : nt!KxFlushEntireTb+0x93
fffff880`009a9b00 fffff800`02ca2819 : 00000000`00000010 00000000`00000000 fffffa80`0169c4d0 00000000`00000010 : nt!KeFlushMultipleRangeTb+0x28c
fffff880`009a9bd0 fffff800`02ca3067 : 00000000`00078900 00000000`0000000f 00000000`00000000 00000000`00000000 : nt!MiZeroPageChain+0x14e
fffff880`009a9c10 fffff800`02f75fda : fffffa80`033e2ac0 00000000`00000080 fffffa80`033e2040 fffff800`02ccc9b9 : nt!MmZeroPageThread+0x83a
fffff880`009a9d40 fffff800`02ccc9c6 : fffff800`02e50e80 fffffa80`033e2ac0 fffff800`02e5ecc0 00000000`00000000 : nt!PspSystemThreadStartup+0x5a
fffff880`009a9d80 00000000`00000000 : 00000000`00000000 00000000`00000000 00000000`00000000 00000000`00000000 : nt!KiStartSystemThread+0x16
STACK_COMMAND: kb
SYMBOL_NAME: ANALYSIS_INCONCLUSIVE
FOLLOWUP_NAME: MachineOwner
MODULE_NAME: Unknown_Module
IMAGE_NAME: Unknown_Image
DEBUG_FLR_IMAGE_TIMESTAMP: 0
FAILURE_BUCKET_ID: X64_CLOCK_WATCHDOG_TIMEOUT_4_PROC_ANALYSIS_INCONCLUSIVE
BUCKET_ID: X64_CLOCK_WATCHDOG_TIMEOUT_4_PROC_ANALYSIS_INCONCLUSIVE
Followup: MachineOwner


")