Bluescreens/AMD-Calatyst Control Center schmiert ab/CPU bis 67°

EpicJesus

Schraubenverwechsler(in)
Bluescreens/AMD-Calatyst Control Center schmiert ab/CPU bis 67°

Hi liebes Forum, bin neu hier :)

So, zu meinem Problem:

Ich war 1 Woche ausser Haus, wollte, nachdem ich wieder da war, meinen Pc anmachen und ein wenig spielen.
Pc lief 5 Minuten: Bluescreen. Dachte ich mir "Ok, wird nur ein kleiner Fehler gewesen sein." Von wegen!
Knapp 20-30 Minuten nachdem ich den Pc immer wieder anschaltete: Bluescreen. (Fehlercodes am Ende)
Der Abstand, bis ich einen Bluescreen bekam, wurde zwar immer länger, aber bei leichter
Belastung (sprich Musik hören, Firefox, Skype) bekam ich immerwieder einen Bluescreen.

Fast bei jedem Mal wo ich den Pc neustartete, kam diese Meldung: imgur: the simple image sharer
Habe dann erstmal die Graka (AMD Radeon HD 6800) rausgenommen, abgestaubt und wieder neu eingebaut.
Hat nicht geholfen. (Nach kurzer Zeit auch wieder Bluescreen)
Danach GrakaTreiber runtergeschmissen (restlos), neustart, neu drauf, neustart.
Dann kam noch ein einziges Mal diese Meldung, und seitdem nicht mehr.
Alles etwas sehr seltsam.

Zudem gilt auch noch zu sagen, dass wenn der Pc 5-6 Stunden (war gestern solange ausser Haus) bei "Leerlauf" anbleibt,
er keine Probleme hat.
BlueScreens treten also nur bei Belastung auf.

Habe vorhin auch den GoatSimulator gespielt, nebenbei SpeedFan laufen gelassen, um zu sehen, wie der Pc sich dann verhält.
CPU auf 65-70°, was ja nochnichtmal soo schlimm ist, aber vor 2 Wochen bevor der Pc 1 Woche lang ausblieb, war der höchstens(!) 40-50° bei voller Leistung gelaufen.

Ich hoffe ihr könnt mir hier weiterhelfen!
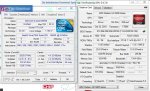
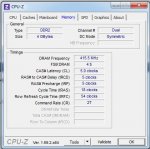
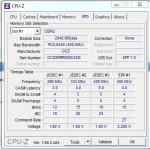
Wenn ihr Daten zum Pc etc. braucht bitte sagen.

Fehlercodes:
-0x00000124
-0x0000003b
-0x00000024
-0x0000000a
-0x0000001a
(diese Fehlercodes innerhalb eines Tages.)

Lg

EpicJesus
 
Lad dir whocrashed herunter und damit kannst die die minidumps im windowsordner auslesen und das programm sagt dir auch was du ändern musst.
 
AW: Bluescreens/AMD-Calatyst Control Center schmiert ab/CPU bis 67°

Hallo.

  1. Angaben zu deinem kompletten System inkl Netzteil
  2. Den Ordner C:\Windows\Minidump zippen und hier hochladen
  3. Bilder von CPU-Z (CPU, Mainboard, Memory, SPD) und GPU-Z hier hoch laden
Dann kann man im Detail analysieren ob eine eindeutige Ursache oder eine Richtung zu finden ist.
 
AW: Bluescreens/AMD-Calatyst Control Center schmiert ab/CPU bis 67°

------------------
System Information
------------------
Time of this report: 6/7/2014, 15:37:49
Machine name: ...-PC
Operating System: Windows 7 Ultimate 64-bit (6.1, Build 7601) Service Pack 1 (7601.win7sp1_gdr.130801-1533)
Language: German (Regional Setting: German)
BIOS: Default System BIOS
Processor: Intel(R) Core(TM)2 Quad CPU Q9550 @ 2.83GHz (4 CPUs), ~2.8GHz
Memory: 4096MB RAM
Available OS Memory: 4096MB RAM
Page File: 4774MB used, 3413MB available
Windows Dir: C:\Windows
DirectX Version: DirectX 11
DX Setup Parameters: Not found
User DPI Setting: 96 DPI (100 percent)
System DPI Setting: 96 DPI (100 percent)
DWM DPI Scaling: Disabled
DxDiag Version: 6.01.7601.17514 64bit Unicode
--
Card name: AMD Radeon HD 6800 Series
Chip type: AMD Radeon Graphics Processor (0x6738)

Minidump.rar :File-Upload.net - Minidump.rar
(Konnte das hier nicht uploaden)
 

Anhänge

  • cpugputest.JPG
    cpugputest.JPG
    118,6 KB · Aufrufe: 170
AW: Bluescreens/AMD-Calatyst Control Center schmiert ab/CPU bis 67°

Welches Netzteil ist bei Dir verbaut?

EDIT: Bilder von CPU-Z (CPU, Mainboard, Memory, SPD) und GPU-Z hier hoch laden
 
AW: Bluescreens/AMD-Calatyst Control Center schmiert ab/CPU bis 67°

Whocrashed sagt folgendes:

__

On Fri 06.06.2014 17:10:55 GMT your computer crashed
crash dump file: C:\Windows\Minidump\060614-48140-01.dmp
This was probably caused by the following module: ntoskrnl.exe (nt+0x4ADE7C)
Bugcheck code: 0x124 (0x0, 0xFFFFFA8004D767C8, 0x0, 0x0)
Error: WHEA_UNCORRECTABLE_ERROR
file path: C:\Windows\system32\ntoskrnl.exe
product: Microsoft® Windows® Operating System
company: Microsoft Corporation
description: NT Kernel & System
Bug check description: This bug check indicates that a fatal hardware error has occurred. This bug check uses the error data that is provided by the Windows Hardware Error Architecture (WHEA).
This is likely to be caused by a hardware problem problem. This problem might be caused by a thermal issue.
The crash took place in the Windows kernel. Possibly this problem is caused by another driver that cannot be identified at this time.


On Fri 06.06.2014 00:01:19 GMT your computer crashed
crash dump file: C:\Windows\Minidump\060614-46453-01.dmp
This was probably caused by the following module: win32k.sys (win32k+0x900E0)
Bugcheck code: 0x3B (0xC0000005, 0xFFFFF960001700E0, 0xFFFFF88008F50DF0, 0x0)
Error: SYSTEM_SERVICE_EXCEPTION
file path: C:\Windows\system32\win32k.sys
product: Betriebssystem Microsoft® Windows®
company: Microsoft Corporation
description: Mehrbenutzer-Win32-Treiber
Bug check description: This indicates that an exception happened while executing a routine that transitions from non-privileged code to privileged code.
This appears to be a typical software driver bug and is not likely to be caused by a hardware problem.
The crash took place in a standard Microsoft module. Your system configuration may be incorrect. Possibly this problem is caused by another driver on your system that cannot be identified at this time.


On Thu 05.06.2014 20:18:34 GMT your computer crashed
crash dump file: C:\Windows\Minidump\060514-52406-01.dmp
This was probably caused by the following module: ntfs.sys (Ntfs+0x4688)
Bugcheck code: 0x24 (0x1904FB, 0xFFFFF8800AE9BE68, 0xFFFFF8800AE9B6C0, 0xFFFFF80002EC7A85)
Error: NTFS_FILE_SYSTEM
file path: C:\Windows\system32\drivers\ntfs.sys
product: Betriebssystem Microsoft® Windows®
company: Microsoft Corporation
description: NT-Dateisystemtreiber
Bug check description: This indicates a problem occurred in the NTFS file system.
The crash took place in a standard Microsoft module. Your system configuration may be incorrect. Possibly this problem is caused by another driver on your system that cannot be identified at this time.


On Thu 05.06.2014 20:03:43 GMT your computer crashed
crash dump file: C:\Windows\Minidump\060514-34234-01.dmp
This was probably caused by the following module: win32k.sys (win32k+0x8F885)
Bugcheck code: 0x3B (0xC0000005, 0xFFFFF9600011F885, 0xFFFFF880097DC040, 0x0)
Error: SYSTEM_SERVICE_EXCEPTION
file path: C:\Windows\system32\win32k.sys
product: Betriebssystem Microsoft® Windows®
company: Microsoft Corporation
description: Mehrbenutzer-Win32-Treiber
Bug check description: This indicates that an exception happened while executing a routine that transitions from non-privileged code to privileged code.
This appears to be a typical software driver bug and is not likely to be caused by a hardware problem.
The crash took place in a standard Microsoft module. Your system configuration may be incorrect. Possibly this problem is caused by another driver on your system that cannot be identified at this time.


On Thu 05.06.2014 19:51:16 GMT your computer crashed
crash dump file: C:\Windows\Minidump\060514-34562-01.dmp
This was probably caused by the following module: Unknown ()
Bugcheck code: 0x0 (0x0, 0x0, 0x0, 0x0)
Error: CUSTOM_ERROR
A third party driver was identified as the probable root cause of this system error.
Google query: CUSTOM_ERROR


On Thu 05.06.2014 19:44:19 GMT your computer crashed
crash dump file: C:\Windows\Minidump\060514-33296-01.dmp
This was probably caused by the following module: ntoskrnl.exe (nt+0x75B80)
Bugcheck code: 0xA (0xFFFFFA7FFFFFFFD0, 0x2, 0x1, 0xFFFFF80002ED44EC)
Error: IRQL_NOT_LESS_OR_EQUAL
file path: C:\Windows\system32\ntoskrnl.exe
product: Microsoft® Windows® Operating System
company: Microsoft Corporation
description: NT Kernel & System
Bug check description: This indicates that Microsoft Windows or a kernel-mode driver accessed paged memory at DISPATCH_LEVEL or above.
This appears to be a typical software driver bug and is not likely to be caused by a hardware problem.
The crash took place in the Windows kernel. Possibly this problem is caused by another driver that cannot be identified at this time.


On Thu 05.06.2014 19:42:45 GMT your computer crashed
crash dump file: C:\Windows\Minidump\060514-33421-01.dmp
This was probably caused by the following module: ntoskrnl.exe (nt+0x75B80)
Bugcheck code: 0x1A (0x5100, 0xFFFFF6FC40062910, 0x1, 0x41F0000029F61929)
Error: MEMORY_MANAGEMENT
file path: C:\Windows\system32\ntoskrnl.exe
product: Microsoft® Windows® Operating System
company: Microsoft Corporation
description: NT Kernel & System
Bug check description: This indicates that a severe memory management error occurred.
This might be a case of memory corruption. More often memory corruption happens because of software errors in buggy drivers, not because of faulty RAM modules.
The crash took place in the Windows kernel. Possibly this problem is caused by another driver that cannot be identified at this time.
 
AW: Bluescreens/AMD-Calatyst Control Center schmiert ab/CPU bis 67°

Netztei: 100-240Vac 750Watt


PS: Eben Errors bei MemTest bekommen.
 

Anhänge

  • memory.JPG
    memory.JPG
    45 KB · Aufrufe: 79
  • mainboard.JPG
    mainboard.JPG
    45,1 KB · Aufrufe: 67
  • spd.JPG
    spd.JPG
    52,8 KB · Aufrufe: 73
AW: Bluescreens/AMD-Calatyst Control Center schmiert ab/CPU bis 67°

Hallo.

Ein Bild vom Datenschild des Netzteiles wäre super:

Dein BIOS ist das P1.10. Asrock hat mittlerweile des P1.40 für dein Board. Ich würde ein Update vornehmen (BIOS Update gehen auf dein Risiko. Also nur vornehmen wenn Dir der Vorgang vertraut ist oder Du das Risiko bereit bist zu tragen!):

Code:
Machine ID Information [From Smbios 2.5, DMIVersion 0, Size=1165]
BiosMajorRelease = 8
BiosMinorRelease = 15
BiosVendor = American Megatrends Inc.
BiosVersion = P1.10
BiosReleaseDate = 09/23/2010
SystemManufacturer = To Be Filled By O.E.M.
SystemProductName = To Be Filled By O.E.M.
SystemFamily = To Be Filled By O.E.M.
SystemVersion = To Be Filled By O.E.M.
SystemSKU = To Be Filled By O.E.M.
BaseBoardManufacturer = ASRock
BaseBoardProduct = G41C-GS
BaseBoardVersion =

Die RAM-Riegel sind in den gelben Slots:

Code:
[SMBIOS Data Tables v2.5]
[DMI Version - 0]
[2.0 Calling Convention - No]
[Table Size - 1165 bytes]

[Memory Controller Information (Type 5) - Length 20 - Handle 0008h]
  Error Detecting Method        06h - 64-bit ECC
  Error Correcting Capability   04h - None 
  Supported Interleave          03h - One Way Interleave
  Current Interleave            03h - One Way Interleave
  Maximum Memory Module Size    0ch - 4096MB
  Supported Speeds              0001h - Other 
  Supported Memory Types        0500h - DIMM SDRAM 
  Memory Module Voltage         3.3V 
  Number of Memory Slots        2
  Memory Slot Handle            0009h
  Memory Slot Handle            000ah
  Enabled Err Correcting Caps   04h - None 
[Memory Module Information (Type 6) - Length 12 - Handle 0009h]
  Socket Designation            DIMM0
  Bank Connections              01h - 1 0
  Current Speed                 1ns
  Current Memory Type           0500h - DIMM SDRAM 
  Installed Size                8bh - 2048 [double bank]
  Enabled Size                  8bh - 2048 [double bank]
  Error Status                  00h - [No Errors] 
[Memory Module Information (Type 6) - Length 12 - Handle 000ah]
  Socket Designation            DIMM1
  Bank Connections              45h - 5 4
  Current Speed                 69ns
  Current Memory Type           0500h - DIMM SDRAM 
  Installed Size                8bh - 2048 [double bank]
  Enabled Size                  8bh - 2048 [double bank]
  Error Status                  00h - [No Errors] 
[Physical Memory Array (Type 16) - Length 15 - Handle 000fh]
  Location                      03h - SystemBoard/Motherboard
  Use                           03h - System Memory
  Memory Error Correction       03h - None
  Maximum Capacity              4194304KB
  Memory Error Inf Handle       [Not Provided]
  Number of Memory Devices      2
[Memory Array Mapped Address (Type 19) - Length 15 - Handle 0010h]
  Starting Address              00000000h
  Ending Address                003fffffh
  Memory Array Handle           000fh
  Partition Width               04
[Memory Device (Type 17) - Length 27 - Handle 0011h]
  Physical Memory Array Handle  000fh
  Memory Error Info Handle      [Not Provided]
  Total Width                   64 bits
  Data Width                    64 bits
  Size                          2048MB
  Form Factor                   09h - DIMM
  Device Set                    [None]
  Device Locator                DIMM0
  Bank Locator                  BANK0
  Memory Type                   0fh - SDRAM
  Type Detail                   0080h - Synchronous
  Speed                         0MHz
  Manufacturer                  Manufacturer00
  Serial Number                         
  Asset Tag Number                          
  Part Number                   ModulePartNumber00
[Memory Device Mapped Address (Type 20) - Length 19 - Handle 0012h]
  Starting Address              00000000h
  Ending Address                001fffffh
  Memory Device Handle          0011h
  Mem Array Mapped Adr Handle   0010h
  Partition Row Position        01
  Interleave Position           [None]
  Interleave Data Depth         01
[Memory Device (Type 17) - Length 27 - Handle 0013h]
  Physical Memory Array Handle  000fh
  Memory Error Info Handle      [Not Provided]
  Total Width                   64 bits
  Data Width                    64 bits
  Size                          2048MB
  Form Factor                   09h - DIMM
  Device Set                    [None]
  Device Locator                DIMM1
  Bank Locator                  BANK1
  Memory Type                   0fh - SDRAM
  Type Detail                   0080h - Synchronous
  Speed                         0MHz
  Manufacturer                  Manufacturer01
  Serial Number                         
  Asset Tag Number                          
  Part Number                   ModulePartNumber01
[Memory Device Mapped Address (Type 20) - Length 19 - Handle 0014h]
  Starting Address              00200000h
  Ending Address                003fffffh
  Memory Device Handle          0013h
  Mem Array Mapped Adr Handle   0010h
  Partition Row Position        01
  Interleave Position           [None]
  Interleave Data Depth         01

Führe einmal MEMTEST86+ mit jeweils EINEM eingebauten Riegel durch.
 
AW: Bluescreens/AMD-Calatyst Control Center schmiert ab/CPU bis 67°

Den ersten getestet : Bei 15% allein schon fast 300 Errors
 
AW: Bluescreens/AMD-Calatyst Control Center schmiert ab/CPU bis 67°

Dann solltest Du Dir neuen RAM zulegen. Da dein Board zwei DDR3 Steckplätze hat kannst gleich auf DDR3 wechseln.
 
AW: Bluescreens/AMD-Calatyst Control Center schmiert ab/CPU bis 67°

So wie es aussieht, läuft wieder alles.

Habe die RamRiegel einzeln getestet, liefen einwandfrei. Dann wieder beide gleichzeitig reingesteckt, läuft auch. (Keine Ahnung wieso!)
Das ist mir aber auch schon öfter passiert seit ich dieses MB habe.

Wenn noch was passieren sollte, schreib ich es hier rein!
Und danke für die Hilfe (vorallem Baerliner) !
 
AW: Bluescreens/AMD-Calatyst Control Center schmiert ab/CPU bis 67°

Das könnte am BIOS liegen. Die neueren BIOS Versionen sind im Bereich Speicherkompatibilität nachgebessert worden.
 
AW: Bluescreens/AMD-Calatyst Control Center schmiert ab/CPU bis 67°

Dann werde ich das BIOS morgen mal updaten! Hab das schonmal gemacht also hab ich ein wenig Erfahrung darin.
 
Zurück