Du verwendest einen veralteten Browser. Es ist möglich, dass diese oder andere Websites nicht korrekt angezeigt werden.
Du solltest ein Upgrade durchführen oder einen alternativen Browser verwenden.
Du solltest ein Upgrade durchführen oder einen alternativen Browser verwenden.
BlueScreen wie jetzt weiter
- Ersteller Jack ONeill
- Erstellt am

simpel1970
Lötkolbengott/-göttin
Prima 
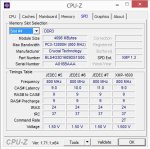
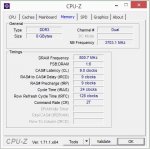
Poste aber bitte den CPU-Z Screenshot "Memory" (nicht SPD)")
Poste aber bitte den CPU-Z Screenshot "Memory" (nicht SPD)

simpel1970
Lötkolbengott/-göttin
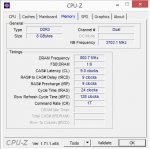
Ok. Das Profil wird zwar nicht ganz korrekt übernommen (eingestellt sind 11-13-13-30 @ 2T anstelle 11-14-14-30 @ 1T), aber schauen wir erst mal, ob dein System nun stabil läuft.
Leider ist es heute schon wieder passiert, ich habe vorsichtshalber alles noch mal so gemacht wie in deiner beschreibung am anfang steht, und poste es einfach hier mit Strg+A Strg+C Strg+V:
Microsoft (R) Windows Debugger Version 6.3.9600.17298 AMD64
Copyright (c) Microsoft Corporation. All rights reserved.
Loading Dump File [C:\Windows\Minidump\113014-5974-01.dmp]
Mini Kernel Dump File: Only registers and stack trace are available
************* Symbol Path validation summary **************
Response Time (ms) Location
Deferred SRV*C:\symbols*http://msdl.microsoft.com/download/symbols
Symbol search path is: SRV*C:\symbols*http://msdl.microsoft.com/download/symbols
Executable search path is:
Windows 7 Kernel Version 7601 (Service Pack 1) MP (8 procs) Free x64
Product: WinNt, suite: TerminalServer SingleUserTS
Built by: 7601.18526.amd64fre.win7sp1_gdr.140706-1506
Machine Name:
Kernel base = 0xfffff800`0305d000 PsLoadedModuleList = 0xfffff800`032a0890
Debug session time: Sun Nov 30 01:18:03.453 2014 (UTC + 1:00)
System Uptime: 0 days 0:29:00.233
Loading Kernel Symbols
.
Press ctrl-c (cdb, kd, ntsd) or ctrl-break (windbg) to abort symbol loads that take too long.
Run !sym noisy before .reload to track down problems loading symbols.
..............................................................
................................................................
......................................
Loading User Symbols
Loading unloaded module list
.....
*******************************************************************************
* *
* Bugcheck Analysis *
* *
*******************************************************************************
Use !analyze -v to get detailed debugging information.
BugCheck C5, {8, 2, 0, fffff80003207a9b}
*** WARNING: Unable to verify timestamp for ladfGSCamd64.sys
*** ERROR: Module load completed but symbols could not be loaded for ladfGSCamd64.sys
Probably caused by : Pool_Corruption ( nt!ExDeferredFreePool+1df )
Followup: Pool_corruption
---------
7: kd> !analyze -v
*******************************************************************************
* *
* Bugcheck Analysis *
* *
*******************************************************************************
DRIVER_CORRUPTED_EXPOOL (c5)
An attempt was made to access a pageable (or completely invalid) address at an
interrupt request level (IRQL) that is too high. This is
caused by drivers that have corrupted the system pool. Run the driver
verifier against any new (or suspect) drivers, and if that doesn't turn up
the culprit, then use gflags to enable special pool.
Arguments:
Arg1: 0000000000000008, memory referenced
Arg2: 0000000000000002, IRQL
Arg3: 0000000000000000, value 0 = read operation, 1 = write operation
Arg4: fffff80003207a9b, address which referenced memory
Debugging Details:
------------------
BUGCHECK_STR: 0xC5_2
CURRENT_IRQL: 2
FAULTING_IP:
nt!ExDeferredFreePool+1df
fffff800`03207a9b 4c395808 cmp qword ptr [rax+8],r11
CUSTOMER_CRASH_COUNT: 1
DEFAULT_BUCKET_ID: WIN7_DRIVER_FAULT
PROCESS_NAME: System
ANALYSIS_VERSION: 6.3.9600.17298 (debuggers(dbg).141024-1500) amd64fre
TRAP_FRAME: fffff8800358c0a0 -- (.trap 0xfffff8800358c0a0)
NOTE: The trap frame does not contain all registers.
Some register values may be zeroed or incorrect.
rax=0000000000000000 rbx=0000000000000000 rcx=fffff80003262b20
rdx=fffffa800c3b7680 rsi=0000000000000000 rdi=0000000000000000
rip=fffff80003207a9b rsp=fffff8800358c230 rbp=0000000000000000
r8=fffffa800c47d4b0 r9=fffffa800c3b7630 r10=0000000000000001
r11=fffffa800c3b7640 r12=0000000000000000 r13=0000000000000000
r14=0000000000000000 r15=0000000000000000
iopl=0 nv up ei ng nz ac po cy
nt!ExDeferredFreePool+0x1df:
fffff800`03207a9b 4c395808 cmp qword ptr [rax+8],r11 ds:00000000`00000008=????????????????
Resetting default scope
LAST_CONTROL_TRANSFER: from fffff800030d2169 to fffff800030d2bc0
STACK_TEXT:
fffff880`0358bf58 fffff800`030d2169 : 00000000`0000000a 00000000`00000008 00000000`00000002 00000000`00000000 : nt!KeBugCheckEx
fffff880`0358bf60 fffff800`030d0de0 : fffffa80`09615000 fffffa80`0c15f3c8 00000000`00000001 00000000`00000000 : nt!KiBugCheckDispatch+0x69
fffff880`0358c0a0 fffff800`03207a9b : 00000000`00000000 fffff800`03262588 fffffa80`0c2b4048 fffff800`03206d0e : nt!KiPageFault+0x260
fffff880`0358c230 fffff800`032064f1 : 3f9d20e4`10e9db52 fffffa80`06c75b00 00000000`00000000 fffffa80`0c15ec9c : nt!ExDeferredFreePool+0x1df
fffff880`0358c2c0 fffff880`0487c397 : 00000000`00000000 00000000`00000000 3f9ef429`4d564253 00000000`00000000 : nt!ExFreePoolWithTag+0x411
fffff880`0358c370 00000000`00000000 : 00000000`00000000 3f9ef429`4d564253 00000000`00000000 fffffa80`0c60e3b0 : ladfGSCamd64+0x397
STACK_COMMAND: kb
FOLLOWUP_IP:
nt!ExDeferredFreePool+1df
fffff800`03207a9b 4c395808 cmp qword ptr [rax+8],r11
SYMBOL_STACK_INDEX: 3
SYMBOL_NAME: nt!ExDeferredFreePool+1df
FOLLOWUP_NAME: Pool_corruption
IMAGE_NAME: Pool_Corruption
DEBUG_FLR_IMAGE_TIMESTAMP: 0
IMAGE_VERSION: 6.1.7601.18526
MODULE_NAME: Pool_Corruption
FAILURE_BUCKET_ID: X64_0xC5_2_nt!ExDeferredFreePool+1df
BUCKET_ID: X64_0xC5_2_nt!ExDeferredFreePool+1df
ANALYSIS_SOURCE: KM
FAILURE_ID_HASH_STRING: km:x64_0xc5_2_nt!exdeferredfreepool+1df
FAILURE_ID_HASH: {cc756c25-7734-be55-230b-59a70003a681}
Followup: Pool_corruption
---------
edit:
habe direckt danach den BIOS auf das neueste upgedatet (1402), danach den XMP Profil wieder eingestellt und an die 100 mhz gedacht, wobei das wurde direckt automatisch von dem profil geändert...
habe noch mal den CPU-Z gestartet und es waren die selben werte wie beim letzten mal, also 11-13-13-30 @ 2T
ich beobachte das jetzt morgen weiter, und hoffe das mein problem damit gelöst ist, wennn nicht... pc neuinstall denke ich
Zuletzt bearbeitet:
simpel1970
Lötkolbengott/-göttin
Laut der Auswertung wurde der Absturz durch die Logitech GSeries Headset Treiber ausgelöst.
Beim nächsten Absturz bitte (neben der Auswertung) auch noch die Minidump hier hochladen.
Beim nächsten Absturz bitte (neben der Auswertung) auch noch die Minidump hier hochladen.
So, den treiber genau wie logitech gaming software erneuert,
gestern etwas hardcore getestet, lief ohne probleme, mal sehen ob es so bleibt, melde mich in paar tagen wenn alles in ordnung ist, oder auch nicht ))
aber an der stelle schon mal ein dickes DANKESCHÖN an dich simpel1970 für die arbeit die du hier verrichtest! hut ab
gestern etwas hardcore getestet, lief ohne probleme, mal sehen ob es so bleibt, melde mich in paar tagen wenn alles in ordnung ist, oder auch nicht ))
aber an der stelle schon mal ein dickes DANKESCHÖN an dich simpel1970 für die arbeit die du hier verrichtest! hut ab
simpel1970
Lötkolbengott/-göttin
Vielen Dank für die Blumen
Ich drücke die Daumen, dass alles reibungsfrei läuft!
Ich drücke die Daumen, dass alles reibungsfrei läuft!
simpel1970
Lötkolbengott/-göttin
Gern geschehen!
Danke für die Rückmeldung.
Danke für die Rückmeldung.
schnigeldi
Schraubenverwechsler(in)
hey simpel,
ich habe mir vor einigen wochen nen pc zusammengebastelt und kämpfe seitdem mit sehr unregelmäßig auftretenden bluescreens. habe gestern nacht das system nochmal neu aufgesetzt und alle treiber erneuert aber da die bsods wieder auftreten, hoffe ich du oder jemand aus der community hier wird daraus schlau...
BAD_POOL_CALLER (c2)
The current thread is making a bad pool request. Typically this is at a bad IRQL level or double freeing the same allocation, etc.
Arguments:
Arg1: 0000000000000011, type of pool violation the caller is guilty of.
Arg2: ffffe000ef77a800
Arg3: 000000000a080008
Arg4: 732f2cd8827c188d
Debugging Details:
------------------
FAULTING_IP:
nt!IopCompleteRequest+78
fffff802`b009e8d8 836310cf and dword ptr [rbx+10h],0FFFFFFCFh
BUGCHECK_STR: 0xc2_11
CUSTOMER_CRASH_COUNT: 1
DEFAULT_BUCKET_ID: WIN8_DRIVER_FAULT
PROCESS_NAME: nvstreamsvc.ex
CURRENT_IRQL: 1
ANALYSIS_VERSION: 6.3.9600.17298 (debuggers(dbg).141024-1500) amd64fre
IRP_ADDRESS: ffffffffffffff88
LAST_CONTROL_TRANSFER: from fffff802b02974e6 to fffff802b0154fa0
STACK_TEXT:
ffffd000`22a2a678 fffff802`b02974e6 : 00000000`000000c2 00000000`00000011 ffffe000`ef77a800 00000000`0a080008 : nt!KeBugCheckEx
ffffd000`22a2a680 fffff802`b009e8d8 : 00000000`00000000 00000000`00000000 00000000`00000000 00000000`00000000 : nt!ExFreePoolWithTag+0x1206
ffffd000`22a2a750 fffff802`b0059416 : 00000000`00000000 00000000`00000000 00000000`00000001 fffff802`b03fd930 : nt!IopCompleteRequest+0x78
ffffd000`22a2a860 fffff802`b0057eaa : 00000000`00000100 00000000`00000000 00000000`00000000 00000000`00000000 : nt!KiDeliverApc+0x166
ffffd000`22a2a8e0 fffff802`b0057779 : ffffe000`f081c880 81d01397`0dfa63b6 7fffffff`ffffffff ffffe000`ef77a840 : nt!KiSwapThread+0x2da
ffffd000`22a2a980 fffff802`b0067dfa : ffffd000`22a2aaa8 00000000`00000000 ffffe000`000000da fffff802`b03fe1c6 : nt!KiCommitThreadWait+0x129
ffffd000`22a2aa00 fffff802`b03fb8d2 : ffffe000`f32d90f0 ffffd000`00000006 00000000`00000000 ffffd000`00000001 : nt!KeWaitForSingleObject+0x22a
ffffd000`22a2aa90 fffff802`b01607b3 : ffffe000`f081c880 000000fe`bea9f030 ffffd000`22a2aad8 ffffe000`f32d90f0 : nt!NtWaitForSingleObject+0xb2
ffffd000`22a2ab00 00007ffa`13b8abca : 00000000`00000000 00000000`00000000 00000000`00000000 00000000`00000000 : nt!KiSystemServiceCopyEnd+0x13
000000fe`c0b1eb48 00000000`00000000 : 00000000`00000000 00000000`00000000 00000000`00000000 00000000`00000000 : 0x00007ffa`13b8abca
STACK_COMMAND: kb
FOLLOWUP_IP:
nt!ExFreePoolWithTag+1206
fffff802`b02974e6 cc int 3
SYMBOL_STACK_INDEX: 1
SYMBOL_NAME: nt!ExFreePoolWithTag+1206
FOLLOWUP_NAME: MachineOwner
MODULE_NAME: nt
IMAGE_NAME: ntkrnlmp.exe
DEBUG_FLR_IMAGE_TIMESTAMP: 5318053f
IMAGE_VERSION: 6.3.9600.17041
BUCKET_ID_FUNC_OFFSET: 1206
FAILURE_BUCKET_ID: 0xc2_11_nt!ExFreePoolWithTag
BUCKET_ID: 0xc2_11_nt!ExFreePoolWithTag
ANALYSIS_SOURCE: KM
FAILURE_ID_HASH_STRING: km:0xc2_11_nt!exfreepoolwithtag
FAILURE_ID_HASH: {3bab653a-201f-303a-9a8a-c4c17ac0e9c2}
Followup: MachineOwner
---------
wäre euch super dankbar wenn ihr mir weiterhelfen könntet. lg
simpel1970
Lötkolbengott/-göttin
Hi, lade mal bitte die Dumps hier im Forum hoch.
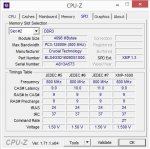
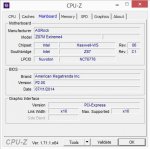
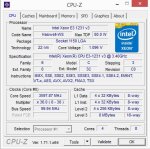
Poste außerdem noch ein paar Screenshots von CPU-Z (Reiter Mainboard, CPU, Memory und SPD).
Sofern die Stopfehlercodes bei den Bluescreens variieren, würde ich dir zunächst empfehlen die RAM mit Memtest86+ zu überprüfen.
Die Prüfung sollte außerhalb von Windows mind. 4-6 Std. laufen; bei Fehlern die Prüfung für jeden RAM Riegel wiederholen, hierfür immer nur den zu prüfenden RAM Riegel einbauen.
Memtest86+ - Advanced Memory Diagnostic Tool
Poste außerdem noch ein paar Screenshots von CPU-Z (Reiter Mainboard, CPU, Memory und SPD).
...und kämpfe seitdem mit sehr unregelmäßig auftretenden bluescreens. habe gestern nacht das system nochmal neu aufgesetzt und alle treiber erneuert aber da die bsods wieder auftreten, hoffe ich du oder jemand aus der community hier wird daraus schlau...
Sofern die Stopfehlercodes bei den Bluescreens variieren, würde ich dir zunächst empfehlen die RAM mit Memtest86+ zu überprüfen.
Die Prüfung sollte außerhalb von Windows mind. 4-6 Std. laufen; bei Fehlern die Prüfung für jeden RAM Riegel wiederholen, hierfür immer nur den zu prüfenden RAM Riegel einbauen.
Memtest86+ - Advanced Memory Diagnostic Tool
schnigeldi
Schraubenverwechsler(in)
danke schonmal.
hier die cpu-z screens und den letzten dump (habe nur einen). den memtest lass ich die nächsten stunden mal laufen.
hier die cpu-z screens und den letzten dump (habe nur einen). den memtest lass ich die nächsten stunden mal laufen.
Anhänge
simpel1970
Lötkolbengott/-göttin
OK. Sofern beim RAM Test keine Fehler gefunden werden, aktiviere im Bios das XMP Profil und beobachte, ob das System dann stabil läuft.
Beim auftreten weiterer Bluescreens, lade bitte gleich die Minidumps hier hoch.
Beim auftreten weiterer Bluescreens, lade bitte gleich die Minidumps hier hoch.
schnigeldi
Schraubenverwechsler(in)
memtest habe ich gestern 5 std durchlaufen lassen, ohne fehler zu bekommen. das xmp profil habe ich ebenfalls aktivert und bis jetzt lief das system auch stabil (zocken, office, surfen etc...).
nur hattee ich gerade eben 2 bluescreens innerhalb von 10 min. meine einzige handlung war, dass ich das headset eingesteckt habe, wobei das gestern abend keine probleme bereitet hat.
hier die 2 dumps
edit: ok mit headset (turtle beach earforce px22) wirds wild. treiber brauchts für das teil allerdings keine
Anhänge
Zuletzt bearbeitet:
simpel1970
Lötkolbengott/-göttin
Ein einheitliches Fehlerbild ist den Dumps nicht zu entnehmen.
Bei zwei Dumps lassen Probleme mit dem Intel LAN Treiber erkennen. Der Treiber ist von Juni 2013. Hier solltest du auf jeden Fall einen aktuelleren Treiber für Win8.1 installieren: Network Connectivity — Drivers and Software for Gigabit Intel® Ethernet Adapters (Windows 8.1 (64-bit); PROWINX64.exe).
Bei zwei weiteren Dumps fällt der Nvidia Streaming Service (-NvStreamKms.sys) allerdings nur im erweiterten Stack- negativ auf. "Nur" deshalb, da ein Treiber, der im erweiterten Stack erscheint nicht zwangsläufig auch die Absturzursache bedeutet.
Dennoch, sollten die Probleme nach der Installation des aktuellsten LAN Treibers immer noch auftreten, deaktiviere testweise den Nvidia Streamer Service.
HowTo Dienste deaktivieren: Services - Start or Disable - Windows 7 Help Forums
Poste bitte auch noch ein aktuellen Screenshot von CPU-Z (Reiter Memory), um zu sehen, wie die RAM nun mit aktivierten XMP eingestellt sind.
schnigeldi
Schraubenverwechsler(in)
ok, habe den lan-treiber erneuert und zur vorsicht auch mal den realtek soundtreiber aktualisiert. ich habe bisher alle treiber von der homepage des mainboardherstellers (asrock) bezogen, die wohl nicht die allerneusten sind...
ich schaue mir die dumpfiles immer mit "bluescreenview" an und dort wurde mir auch vor der neuaufsetzung meines systems immer der treiber "ntoskrnl.exe" und die Adresse "ntoskrnl.exe+14f1a0" als verursacher angezeigt. so wie im neuesten minidump von heute morgen auch. ist das der lantreiber gewesen?
viele danke simpel für deine geopferte freizeit
Anhänge
simpel1970
Lötkolbengott/-göttin
und die Adresse "ntoskrnl.exe+14f1a0" als verursacher angezeigt. so wie im neuesten minidump von heute morgen auch. ist das der lantreiber gewesen?
Nein, das ist die Adresse der ntoskrnl.exe.
Um es kurz zu fassen...Bluescreenview eignet sich dafür, um eine Übersicht der aufgetretenen Stopfehlercodes zu erstellen, das war es aber schon. Eine seriöse Auswertung ist mit dem Tool nicht möglich.
Jetzt schau ma mal, wie es läuft (*daumendrück*)
Ähnliche Themen
- Antworten
- 0
- Aufrufe
- 821
- Antworten
- 2
- Aufrufe
- 2K
- Antworten
- 0
- Aufrufe
- 792
- Antworten
- 4
- Aufrufe
- 2K