Windows 10 Bluescreen bei Inaktivität
Hallo erstmal,
also ich habe folgendes Problem und leider komm ich selber nicht dahinter wo der Fehler liegt.
Vor ca 2 Wochen hab ich mir einen neuen Computer zusammen bauen lassen und zu beginn lief das ganze auch recht gut.
Hatte dann aber täglich einen Bluescreen mit der Meldung "Kernel_Security_Check_Failure"(Ohne Nummerierten Fehlercode),
worauf man mir geraten hatte mein GPU Treiber von Nvidia direkt zu beziehen und nicht über Windows (Was wohl bei der erst Installation der fall war).
Nun gut so weit dann lief alles bis gestern, ich war ca 15-20 Minuten Inaktiv und hatte einen neuen Bluescreen mit folgender Meldung "Kmode_Exception_not_Handled"(Ohne Nummerierten Fehlercode),
das passierte danach noch 2 weitere male worauf Windows eine Reparatur forderte der ich auch folgte.
Das Problem besteht aber weiterhin.
Also im Grunde ist das Problem das der PC bei einer Inaktivität immer einen Fehler bringt was es mir unmöglich macht irgendwas laufen zu lassen während ich abwesend bin. Solange ich irgendetwas mache passiert absolut nichts dergleichen.
Ich hatte versucht das Dump File auszulesen aber irgendwie wird das nichts :|
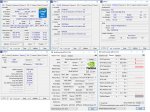
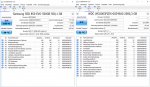
Ich hab mal die 2 letzten Dump Files mit angehängt sowie Screenshots aus CrystalDiskInfo(Meine Externe HDD habe ich nicht beigefügt), CPUZ und GPUZ. Sollte etwas weiteres nötig sein lasst es mich wissen.
Ich hoffe jemand kann mir hier weiter helfen. Danke schon mal an jeden der sich zeit nimmt")
Dump-File Inhalt
EDIT1:
"Probably caused by : ntkrnlmp.exe" - Defekte RAM? Memtest86 hatte keinen Fehler angezeigt beim Normalen Durchlauf.
Hallo erstmal,
also ich habe folgendes Problem und leider komm ich selber nicht dahinter wo der Fehler liegt.
Vor ca 2 Wochen hab ich mir einen neuen Computer zusammen bauen lassen und zu beginn lief das ganze auch recht gut.
Hatte dann aber täglich einen Bluescreen mit der Meldung "Kernel_Security_Check_Failure"(Ohne Nummerierten Fehlercode),
worauf man mir geraten hatte mein GPU Treiber von Nvidia direkt zu beziehen und nicht über Windows (Was wohl bei der erst Installation der fall war).
Nun gut so weit dann lief alles bis gestern, ich war ca 15-20 Minuten Inaktiv und hatte einen neuen Bluescreen mit folgender Meldung "Kmode_Exception_not_Handled"(Ohne Nummerierten Fehlercode),
das passierte danach noch 2 weitere male worauf Windows eine Reparatur forderte der ich auch folgte.
Das Problem besteht aber weiterhin.
Also im Grunde ist das Problem das der PC bei einer Inaktivität immer einen Fehler bringt was es mir unmöglich macht irgendwas laufen zu lassen während ich abwesend bin. Solange ich irgendetwas mache passiert absolut nichts dergleichen.
Ich hatte versucht das Dump File auszulesen aber irgendwie wird das nichts :|
Ich hab mal die 2 letzten Dump Files mit angehängt sowie Screenshots aus CrystalDiskInfo(Meine Externe HDD habe ich nicht beigefügt), CPUZ und GPUZ. Sollte etwas weiteres nötig sein lasst es mich wissen.
Ich hoffe jemand kann mir hier weiter helfen. Danke schon mal an jeden der sich zeit nimmt
Dump-File Inhalt
EDIT1:
Microsoft (R) Windows Debugger Version 10.0.14321.1024 AMD64
Copyright (c) Microsoft Corporation. All rights reserved.
Loading Dump File [C:\Windows\MEMORY.DMP]
Kernel Bitmap Dump File: Kernel address space is available, User address space may not be available.
************* Symbol Path validation summary **************
Response Time (ms) Location
Deferred SRV*C:\symbols*http://msdl.microsoft.com/download/symbols
Symbol search path is: SRV*C:\symbols*http://msdl.microsoft.com/download/symbols
Executable search path is:
Windows 10 Kernel Version 10586 MP (8 procs) Free x64
Product: WinNt, suite: TerminalServer SingleUserTS Personal
Built by: 10586.589.amd64fre.th2_release.160906-1759
Machine Name:
Kernel base = 0xfffff803`13a7b000 PsLoadedModuleList = 0xfffff803`13d58cd0
Debug session time: Fri Sep 30 16:12:06.594 2016 (UTC + 2:00)
System Uptime: 0 days 0:10:23.247
Loading Kernel Symbols
.............................................................Page 1f1c88 not present in the dump file. Type ".hh dbgerr004" for details
..
.....Page 1f3914 not present in the dump file. Type ".hh dbgerr004" for details
...........................................................
..............................................
Loading User Symbols
Loading unloaded module list
............
*******************************************************************************
* *
* Bugcheck Analysis *
* *
*******************************************************************************
Use !analyze -v to get detailed debugging information.
BugCheck 7E, {ffffffffc0000005, fffff80313f15a0f, ffffd0016e1f2758, ffffd0016e1f1f70}
Page 1f1c88 not present in the dump file. Type ".hh dbgerr004" for details
Page 1f1c88 not present in the dump file. Type ".hh dbgerr004" for details
Page 1f3914 not present in the dump file. Type ".hh dbgerr004" for details
Page 1f3914 not present in the dump file. Type ".hh dbgerr004" for details
Page 1080 not present in the dump file. Type ".hh dbgerr004" for details
Page 1080 not present in the dump file. Type ".hh dbgerr004" for details
Page 1080 not present in the dump file. Type ".hh dbgerr004" for details
Probably caused by : ntkrnlmp.exe ( nt!CmpCleanUpKcbCacheWithLock+9f )
Followup: MachineOwner
---------
2: kd> !analyze -v
*******************************************************************************
* *
* Bugcheck Analysis *
* *
*******************************************************************************
SYSTEM_THREAD_EXCEPTION_NOT_HANDLED (7e)
This is a very common bugcheck. Usually the exception address pinpoints
the driver/function that caused the problem. Always note this address
as well as the link date of the driver/image that contains this address.
Arguments:
Arg1: ffffffffc0000005, The exception code that was not handled
Arg2: fffff80313f15a0f, The address that the exception occurred at
Arg3: ffffd0016e1f2758, Exception Record Address
Arg4: ffffd0016e1f1f70, Context Record Address
Debugging Details:
------------------
Page 1080 not present in the dump file. Type ".hh dbgerr004" for details
Page 1080 not present in the dump file. Type ".hh dbgerr004" for details
Page 1080 not present in the dump file. Type ".hh dbgerr004" for details
DUMP_CLASS: 1
DUMP_QUALIFIER: 401
BUILD_VERSION_STRING: 10586.589.amd64fre.th2_release.160906-1759
SYSTEM_MANUFACTURER: MSI
SYSTEM_PRODUCT_NAME: MS-7971
SYSTEM_SKU: Default string
SYSTEM_VERSION: 1.0
BIOS_VENDOR: American Megatrends Inc.
BIOS_VERSION: 1.D0
BIOS_DATE: 08/30/2016
BASEBOARD_MANUFACTURER: MSI
BASEBOARD_PRODUCT: Z170-A PRO (MS-7971)
BASEBOARD_VERSION: 1.0
DUMP_TYPE: 1
BUGCHECK_P1: ffffffffc0000005
BUGCHECK_P2: fffff80313f15a0f
BUGCHECK_P3: ffffd0016e1f2758
BUGCHECK_P4: ffffd0016e1f1f70
EXCEPTION_CODE: (NTSTATUS) 0xc0000005 - Die Anweisung in 0x%p verwies auf Arbeitsspeicher bei 0x%p. Der Vorgang %s konnte im Arbeitsspeicher nicht durchgef hrt werden.
FAULTING_IP:
nt!CmpCleanUpKcbCacheWithLock+9f
fffff803`13f15a0f 488b02 mov rax,qword ptr [rdx]
EXCEPTION_RECORD: ffffd0016e1f2758 -- (.exr 0xffffd0016e1f2758)
ExceptionAddress: fffff80313f15a0f (nt!CmpCleanUpKcbCacheWithLock+0x000000000000009f)
ExceptionCode: c0000005 (Access violation)
ExceptionFlags: 00000000
NumberParameters: 2
Parameter[0]: 0000000000000000
Parameter[1]: ffffffffffffffff
Attempt to read from address ffffffffffffffff
CONTEXT: ffffd0016e1f1f70 -- (.cxr 0xffffd0016e1f1f70)
rax=3633646136353833 rbx=ffffc00176c9fa70 rcx=00000000000001ff
rdx=363364613635383b rsi=0000000000000000 rdi=ffffc00176c9f948
rip=fffff80313f15a0f rsp=ffffd0016e1f2990 rbp=0000000000000004
r8=ffffc0016f744000 r9=ffffc00176c9fa80 r10=7fffc00160e2ff30
r11=7ffffffffffffffc r12=0000000000000000 r13=fffff80313d74440
r14=0000000000000002 r15=fffff80313e0d200
iopl=0 nv up ei pl nz na pe nc
cs=0010 ss=0018 ds=002b es=002b fs=0053 gs=002b efl=00010202
nt!CmpCleanUpKcbCacheWithLock+0x9f:
fffff803`13f15a0f 488b02 mov rax,qword ptr [rdx] ds:002b:36336461`3635383b=????????????????
Resetting default scope
CPU_COUNT: 8
CPU_MHZ: fa8
CPU_VENDOR: GenuineIntel
CPU_FAMILY: 6
CPU_MODEL: 5e
CPU_STEPPING: 3
CPU_MICROCODE: 6,5e,3,0 (F,M,S,R) SIG: 9E'00000000 (cache) 9E'00000000 (init)
DEFAULT_BUCKET_ID: WIN8_DRIVER_FAULT
PROCESS_NAME: System
CURRENT_IRQL: 0
ERROR_CODE: (NTSTATUS) 0xc0000005 - Die Anweisung in 0x%p verwies auf Arbeitsspeicher bei 0x%p. Der Vorgang %s konnte im Arbeitsspeicher nicht durchgef hrt werden.
EXCEPTION_CODE_STR: c0000005
EXCEPTION_PARAMETER1: 0000000000000000
EXCEPTION_PARAMETER2: ffffffffffffffff
FOLLOWUP_IP:
nt!CmpCleanUpKcbCacheWithLock+9f
fffff803`13f15a0f 488b02 mov rax,qword ptr [rdx]
READ_ADDRESS: ffffffffffffffff
BUGCHECK_STR: AV
ANALYSIS_SESSION_HOST: DESKTOP-K6GQUJU
ANALYSIS_SESSION_TIME: 09-30-2016 21:14:47.0849
ANALYSIS_VERSION: 10.0.14321.1024 amd64fre
LAST_CONTROL_TRANSFER: from fffff80313f15fc9 to fffff80313f15a0f
STACK_TEXT:
ffffd001`6e1f2990 fffff803`13f15fc9 : 00000000`00000002 ffffd001`6e1f2a18 ffffd001`6e1f2a10 ffffd001`6e1f2a40 : nt!CmpCleanUpKcbCacheWithLock+0x9f
ffffd001`6e1f29c0 fffff803`13b4d399 : ffffe000`76727040 fffff803`13f15e50 fffff803`13d743e0 ffffe000`7c48fcf0 : nt!CmpDelayCloseWorker+0x179
ffffd001`6e1f2a80 fffff803`13ac1ab5 : 0000008d`bd9bbfff 00000000`00000080 ffffe000`710cc700 ffffe000`76727040 : nt!ExpWorkerThread+0xe9
ffffd001`6e1f2b10 fffff803`13bc2b16 : ffffd001`6bd83180 ffffe000`76727040 fffff803`13ac1a74 ffffd001`6c316b00 : nt!PspSystemThreadStartup+0x41
ffffd001`6e1f2b60 00000000`00000000 : ffffd001`6e1f3000 ffffd001`6e1ec000 00000000`00000000 00000000`00000000 : nt!KiStartSystemThread+0x16
THREAD_SHA1_HASH_MOD_FUNC: c49cd64167406695adc82f0995da007bf149293b
THREAD_SHA1_HASH_MOD_FUNC_OFFSET: a4d559e95ba729bc4ac9a246379fbdc6a4f0f943
THREAD_SHA1_HASH_MOD: f08ac56120cad14894587db086f77ce277bfae84
FAULT_INSTR_CODE: 48028b48
SYMBOL_STACK_INDEX: 0
SYMBOL_NAME: nt!CmpCleanUpKcbCacheWithLock+9f
FOLLOWUP_NAME: MachineOwner
MODULE_NAME: nt
IMAGE_NAME: ntkrnlmp.exe
DEBUG_FLR_IMAGE_TIMESTAMP: 57cf9490
STACK_COMMAND: .cxr 0xffffd0016e1f1f70 ; kb
BUCKET_ID_FUNC_OFFSET: 9f
FAILURE_BUCKET_ID: AV_nt!CmpCleanUpKcbCacheWithLock
BUCKET_ID: AV_nt!CmpCleanUpKcbCacheWithLock
PRIMARY_PROBLEM_CLASS: AV_nt!CmpCleanUpKcbCacheWithLock
TARGET_TIME: 2016-09-30T14:12:06.000Z
OSBUILD: 10586
OSSERVICEPACK: 0
SERVICEPACK_NUMBER: 0
OS_REVISION: 0
SUITE_MASK: 784
PRODUCT_TYPE: 1
OSPLATFORM_TYPE: x64
OSNAME: Windows 10
OSEDITION: Windows 10 WinNt TerminalServer SingleUserTS Personal
OS_LOCALE:
USER_LCID: 0
OSBUILD_TIMESTAMP: 2016-09-07 06:16:16
BUILDDATESTAMP_STR: 160906-1759
BUILDLAB_STR: th2_release
BUILDOSVER_STR: 10.0.10586.589.amd64fre.th2_release.160906-1759
ANALYSIS_SESSION_ELAPSED_TIME: 1363
ANALYSIS_SOURCE: KM
FAILURE_ID_HASH_STRING: km:av_nt!cmpcleanupkcbcachewithlock
FAILURE_ID_HASH: {cc17e2c6-0f1c-0561-5c53-87b2fafbcf3d}
Followup: MachineOwner
---------
2: kd> lmvm nt
Browse full module list
start end module name
fffff803`13a7b000 fffff803`14245000 nt (pdb symbols) c:\symbols\ntkrnlmp.pdb\8265940F5964455DB7497EDC4B63E0BA1\ntkrnlmp.pdb
Loaded symbol image file: ntkrnlmp.exe
Image path: ntkrnlmp.exe
Image name: ntkrnlmp.exe
Browse all global symbols functions data
Timestamp: Wed Sep 7 06:16:16 2016 (57CF9490)
CheckSum: 0072797B
ImageSize: 007CA000
Translations: 0000.04b0 0000.04e4 0409.04b0 0409.04e4
"Probably caused by : ntkrnlmp.exe" - Defekte RAM? Memtest86 hatte keinen Fehler angezeigt beim Normalen Durchlauf.
Anhänge
Zuletzt bearbeitet: