Guten Tag,
ich hoffe ich bin im richtigen Unterforum und ihr könnt mir weiterhelfen")
Mein System:
OS: Win7 64 bit
MB: MSI P55 GD65
CPU: I7 860
GPU: Zotac GTX 470
RAM: 4GB GSkill
NT: BQT E7 600W

Das Problem:
Ich bekomme beim zocken von PES 13 (Demo1, Demo2 und Vollversion) spätestens bei der zweiten Partie einen Bluescreen.
Spiele wie GTA 4, Sniper Elite V2 und Anno 2070 funktionieren ohne Probleme.
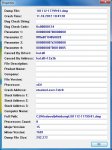
Hier ein Screen von Bluescreenview:

WinDbg sagt folgendes:
.gif "sm_=) =)")
ich hoffe ich bin im richtigen Unterforum und ihr könnt mir weiterhelfen
Mein System:
OS: Win7 64 bit
MB: MSI P55 GD65
CPU: I7 860
GPU: Zotac GTX 470
RAM: 4GB GSkill
NT: BQT E7 600W

Das Problem:
Ich bekomme beim zocken von PES 13 (Demo1, Demo2 und Vollversion) spätestens bei der zweiten Partie einen Bluescreen.
Spiele wie GTA 4, Sniper Elite V2 und Anno 2070 funktionieren ohne Probleme.
Hier ein Screen von Bluescreenview:
WinDbg sagt folgendes:
Vielen Dank für die HilfeMicrosoft (R) Windows Debugger Version 6.2.9200.16384 AMD64
Copyright (c) Microsoft Corporation. All rights reserved.
Loading Dump File [C:\Windows\Minidump\101112-17799-01.dmp]
Mini Kernel Dump File: Only registers and stack trace are available
Symbol search path is: SRV*C:\symbols*http://msdl.microsoft.com/download/symbols
Executable search path is:
Windows 7 Kernel Version 7601 (Service Pack 1) MP (8 procs) Free x64
Product: WinNt, suite: TerminalServer SingleUserTS Personal
Built by: 7601.17944.amd64fre.win7sp1_gdr.120830-0333
Machine Name:
Kernel base = 0xfffff800`0345b000 PsLoadedModuleList = 0xfffff800`0369f670
Debug session time: Thu Oct 11 10:39:52.839 2012 (UTC + 2:00)
System Uptime: 0 days 0:18:11.869
Loading Kernel Symbols
...............................................................
................................................................
...........................
Loading User Symbols
Loading unloaded module list
......
*******************************************************************************
* *
* Bugcheck Analysis *
* *
*******************************************************************************
Use !analyze -v to get detailed debugging information.
BugCheck 124, {0, fffffa8004858028, b2000000, 10005}
Probably caused by : GenuineIntel
Followup: MachineOwner
---------
0: kd> !analyze -v
*******************************************************************************
* *
* Bugcheck Analysis *
* *
*******************************************************************************
WHEA_UNCORRECTABLE_ERROR (124)
A fatal hardware error has occurred. Parameter 1 identifies the type of error
source that reported the error. Parameter 2 holds the address of the
WHEA_ERROR_RECORD structure that describes the error conditon.
Arguments:
Arg1: 0000000000000000, Machine Check Exception
Arg2: fffffa8004858028, Address of the WHEA_ERROR_RECORD structure.
Arg3: 00000000b2000000, High order 32-bits of the MCi_STATUS value.
Arg4: 0000000000010005, Low order 32-bits of the MCi_STATUS value.
Debugging Details:
------------------
BUGCHECK_STR: 0x124_GenuineIntel
CUSTOMER_CRASH_COUNT: 1
DEFAULT_BUCKET_ID: WIN7_DRIVER_FAULT
PROCESS_NAME: pes2013.exe
CURRENT_IRQL: f
STACK_TEXT:
fffff800`00ba8a98 fffff800`03424a3b : 00000000`00000124 00000000`00000000 fffffa80`04858028 00000000`b2000000 : nt!KeBugCheckEx
fffff800`00ba8aa0 fffff800`035e7b13 : 00000000`00000001 fffffa80`049cbc90 00000000`00000000 fffffa80`049cbce0 : hal!HalBugCheckSystem+0x1e3
fffff800`00ba8ae0 fffff800`03424700 : 00000000`00000728 fffffa80`049cbc90 fffff800`00ba8e70 fffff800`00ba8e00 : nt!WheaReportHwError+0x263
fffff800`00ba8b40 fffff800`03424052 : fffffa80`049cbc90 fffff800`00ba8e70 fffffa80`049cbc90 00000000`00000000 : hal!HalpMcaReportError+0x4c
fffff800`00ba8c90 fffff800`03423f0d : 00000000`00000008 00000000`00000001 fffff800`00ba8ef0 00000000`00000000 : hal!HalpMceHandler+0x9e
fffff800`00ba8cd0 fffff800`03417e88 : fffff880`063f0720 00000000`00000000 00000000`00000000 00000000`00000000 : hal!HalpMceHandlerWithRendezvous+0x55
fffff800`00ba8d00 fffff800`034d88ac : 00000000`00000000 00000000`00000000 00000000`00000000 00000000`00000000 : hal!HalHandleMcheck+0x40
fffff800`00ba8d30 fffff800`034d8713 : 00000000`00000000 00000000`00000000 00000000`00000000 00000000`00000000 : nt!KxMcheckAbort+0x6c
fffff800`00ba8e70 fffff800`034e3116 : 00000000`00000000 00000000`00000000 00000000`00000000 00000000`00000000 : nt!KiMcheckAbort+0x153
fffff880`063f0430 00000000`00000000 : 00000000`00000000 00000000`00000000 00000000`00000000 00000000`00000000 : nt!ObfDereferenceObject+0x16
STACK_COMMAND: kb
FOLLOWUP_NAME: MachineOwner
MODULE_NAME: GenuineIntel
IMAGE_NAME: GenuineIntel
DEBUG_FLR_IMAGE_TIMESTAMP: 0
FAILURE_BUCKET_ID: X64_0x124_GenuineIntel_PROCESSOR_MAE
BUCKET_ID: X64_0x124_GenuineIntel_PROCESSOR_MAE
Followup: MachineOwner
Anhänge
Zuletzt bearbeitet:


")
