PC stürzt zurzeit häufig ab / Dump File auslesen
Hi, mein PC ist Heute zum dritten mal innerhalb von etwa 4 Tagen abgestürzt. Ich surfe immer etwas im Internet, dann kommt plötzlich ein Bluescreen (blauer Bildschirm mit weißer Schrift) und kurz darauf startet mein PC neu. Ich hab mich daraufhin schon etwas informiert, und jetzt die Dump File unter "C:\Windows\Minidump" ausgelesen. Leider kann ich absolut nichts mit dem Inhalt der dmp-Datei anfangen.
Gibt es jemanden der sich da auskennt und aus der Datei herauslesen kann wo der Fehler liegt? Oder hat jemand Erfahrung und weiß was ein typicher Fehler für so einen Absturz sein könnte?
Vielen Dank für eure Hilfe. MFG Marco
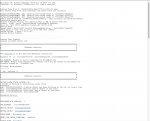
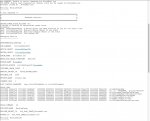
Den Inhalt der Datei seht ihr auf den Bildern und unter diesem Text.
----------------------------------------------------------------------------------------------------------------------------------------------------------------------------------
Microsoft (R) Windows Debugger Version 6.10.0003.233 X86
Copyright (c) Microsoft Corporation. All rights reserved.
Loading Dump File [C:\Windows\Minidump\072914-22432-01.dmp]
Mini Kernel Dump File: Only registers and stack trace are available
DbsSplayTreeRangeMap::Add: ignoring zero-sized range at ?fffff8a0`04004c32?
DbsSplayTreeRangeMap::Add: ignoring zero-sized range at ?fffff8a0`002467f2?
DbsSplayTreeRangeMap::Add: ignoring zero-sized range at ?fffff800`00ba2730?
Symbol search path is: srv*DownstreamStore*http://msdl.microsoft.com/download/symbols
Executable search path is:
Windows 7 Kernel Version 7601 (Service Pack 1) MP (4 procs) Free x64
Product: WinNt, suite: TerminalServer SingleUserTS Personal
Built by: 7601.18409.amd64fre.win7sp1_gdr.140303-2144
Machine Name:
Kernel base = 0xfffff800`03c66000 PsLoadedModuleList = 0xfffff800`03ea9890
Debug session time: Tue Jul 29 13:37:52.888 2014 (GMT+2)
System Uptime: 1 days 2:36:52.427
Loading Kernel Symbols
...............................................................
................................................................
...........................................................
Loading User Symbols
Loading unloaded module list
.........
*******************************************************************************
* *
* Bugcheck Analysis *
* *
*******************************************************************************
Use !analyze -v to get detailed debugging information.
BugCheck 9F, {3, fffffa8007ea3790, fffff80000ba2748, fffffa800db78090}
*** WARNING: Unable to verify timestamp for EtronHub3.sys
*** ERROR: Module load completed but symbols could not be loaded for EtronHub3.sys
Probably caused by : EtronHub3.sys
Followup: MachineOwner
---------
0: kd> !analyze -v
*******************************************************************************
* *
* Bugcheck Analysis *
* *
*******************************************************************************
DRIVER_POWER_STATE_FAILURE (9f)
A driver is causing an inconsistent power state.
Arguments:
Arg1: 0000000000000003, A device object has been blocking an Irp for too long a time
Arg2: fffffa8007ea3790, Physical Device Object of the stack
Arg3: fffff80000ba2748, Functional Device Object of the stack
Arg4: fffffa800db78090, The blocked IRP
Debugging Details:
------------------
DRVPOWERSTATE_SUBCODE: 3
IRP_ADDRESS: fffffa800db78090
DEVICE_OBJECT: fffffa8007ea3790
DRIVER_OBJECT: fffffa800a635de0
IMAGE_NAME: EtronHub3.sys
DEBUG_FLR_IMAGE_TIMESTAMP: 4e0c1196
MODULE_NAME: EtronHub3
FAULTING_MODULE: fffff88007ee1000 EtronHub3
CUSTOMER_CRASH_COUNT: 1
DEFAULT_BUCKET_ID: VISTA_DRIVER_FAULT
BUGCHECK_STR: 0x9F
PROCESS_NAME: svchost.exe
CURRENT_IRQL: 2
LAST_CONTROL_TRANSFER: from fffff80003d4b8d2 to fffff80003cdbbc0
STACK_TEXT:
fffff800`00ba26f8 fffff800`03d4b8d2 : 00000000`0000009f 00000000`00000003 fffffa80`07ea3790 fffff800`00ba2748 : nt!KeBugCheckEx
fffff800`00ba2700 fffff800`03ce685c : fffff800`00ba2830 fffff800`00ba2830 00000000`00000000 00000000`00000001 : nt! ?? ::FNODOBFM::`string'+0x33af0
fffff800`00ba27a0 fffff800`03ce66f6 : fffff800`03e8c140 00000000`005db756 00000000`00000000 fffffa80`0a482000 : nt!KiProcessTimerDpcTable+0x6c
fffff800`00ba2810 fffff800`03ce65de : 000000df`14a82dc2 fffff800`00ba2e88 00000000`005db756 fffff800`03e59d48 : nt!KiProcessExpiredTimerList+0xc6
fffff800`00ba2e60 fffff800`03ce63c7 : fffff800`03e56ec1 fffffa80`005db756 fffffa80`0a449a30 00000000`00000056 : nt!KiTimerExpiration+0x1be
fffff800`00ba2f00 fffff800`03cded15 : 00000000`00000000 fffffa80`0d0e5060 00000000`00000000 fffff880`07449db0 : nt!KiRetireDpcList+0x277
fffff800`00ba2fb0 fffff800`03cdeb2c : 00000000`00000000 00000000`00000000 00000000`00000000 00000000`00000000 : nt!KyRetireDpcList+0x5
fffff880`0c25faa0 00000000`00000000 : 00000000`00000000 00000000`00000000 00000000`00000000 00000000`00000000 : nt!KiDispatchInterruptContinue
STACK_COMMAND: kb
FOLLOWUP_NAME: MachineOwner
FAILURE_BUCKET_ID: X64_0x9F_IMAGE_EtronHub3.sys
BUCKET_ID: X64_0x9F_IMAGE_EtronHub3.sys
Followup: MachineOwner
---------
Hi, mein PC ist Heute zum dritten mal innerhalb von etwa 4 Tagen abgestürzt. Ich surfe immer etwas im Internet, dann kommt plötzlich ein Bluescreen (blauer Bildschirm mit weißer Schrift) und kurz darauf startet mein PC neu. Ich hab mich daraufhin schon etwas informiert, und jetzt die Dump File unter "C:\Windows\Minidump" ausgelesen. Leider kann ich absolut nichts mit dem Inhalt der dmp-Datei anfangen.
Gibt es jemanden der sich da auskennt und aus der Datei herauslesen kann wo der Fehler liegt? Oder hat jemand Erfahrung und weiß was ein typicher Fehler für so einen Absturz sein könnte?
Vielen Dank für eure Hilfe. MFG Marco
Den Inhalt der Datei seht ihr auf den Bildern und unter diesem Text.
----------------------------------------------------------------------------------------------------------------------------------------------------------------------------------
Microsoft (R) Windows Debugger Version 6.10.0003.233 X86
Copyright (c) Microsoft Corporation. All rights reserved.
Loading Dump File [C:\Windows\Minidump\072914-22432-01.dmp]
Mini Kernel Dump File: Only registers and stack trace are available
DbsSplayTreeRangeMap::Add: ignoring zero-sized range at ?fffff8a0`04004c32?
DbsSplayTreeRangeMap::Add: ignoring zero-sized range at ?fffff8a0`002467f2?
DbsSplayTreeRangeMap::Add: ignoring zero-sized range at ?fffff800`00ba2730?
Symbol search path is: srv*DownstreamStore*http://msdl.microsoft.com/download/symbols
Executable search path is:
Windows 7 Kernel Version 7601 (Service Pack 1) MP (4 procs) Free x64
Product: WinNt, suite: TerminalServer SingleUserTS Personal
Built by: 7601.18409.amd64fre.win7sp1_gdr.140303-2144
Machine Name:
Kernel base = 0xfffff800`03c66000 PsLoadedModuleList = 0xfffff800`03ea9890
Debug session time: Tue Jul 29 13:37:52.888 2014 (GMT+2)
System Uptime: 1 days 2:36:52.427
Loading Kernel Symbols
...............................................................
................................................................
...........................................................
Loading User Symbols
Loading unloaded module list
.........
*******************************************************************************
* *
* Bugcheck Analysis *
* *
*******************************************************************************
Use !analyze -v to get detailed debugging information.
BugCheck 9F, {3, fffffa8007ea3790, fffff80000ba2748, fffffa800db78090}
*** WARNING: Unable to verify timestamp for EtronHub3.sys
*** ERROR: Module load completed but symbols could not be loaded for EtronHub3.sys
Probably caused by : EtronHub3.sys
Followup: MachineOwner
---------
0: kd> !analyze -v
*******************************************************************************
* *
* Bugcheck Analysis *
* *
*******************************************************************************
DRIVER_POWER_STATE_FAILURE (9f)
A driver is causing an inconsistent power state.
Arguments:
Arg1: 0000000000000003, A device object has been blocking an Irp for too long a time
Arg2: fffffa8007ea3790, Physical Device Object of the stack
Arg3: fffff80000ba2748, Functional Device Object of the stack
Arg4: fffffa800db78090, The blocked IRP
Debugging Details:
------------------
DRVPOWERSTATE_SUBCODE: 3
IRP_ADDRESS: fffffa800db78090
DEVICE_OBJECT: fffffa8007ea3790
DRIVER_OBJECT: fffffa800a635de0
IMAGE_NAME: EtronHub3.sys
DEBUG_FLR_IMAGE_TIMESTAMP: 4e0c1196
MODULE_NAME: EtronHub3
FAULTING_MODULE: fffff88007ee1000 EtronHub3
CUSTOMER_CRASH_COUNT: 1
DEFAULT_BUCKET_ID: VISTA_DRIVER_FAULT
BUGCHECK_STR: 0x9F
PROCESS_NAME: svchost.exe
CURRENT_IRQL: 2
LAST_CONTROL_TRANSFER: from fffff80003d4b8d2 to fffff80003cdbbc0
STACK_TEXT:
fffff800`00ba26f8 fffff800`03d4b8d2 : 00000000`0000009f 00000000`00000003 fffffa80`07ea3790 fffff800`00ba2748 : nt!KeBugCheckEx
fffff800`00ba2700 fffff800`03ce685c : fffff800`00ba2830 fffff800`00ba2830 00000000`00000000 00000000`00000001 : nt! ?? ::FNODOBFM::`string'+0x33af0
fffff800`00ba27a0 fffff800`03ce66f6 : fffff800`03e8c140 00000000`005db756 00000000`00000000 fffffa80`0a482000 : nt!KiProcessTimerDpcTable+0x6c
fffff800`00ba2810 fffff800`03ce65de : 000000df`14a82dc2 fffff800`00ba2e88 00000000`005db756 fffff800`03e59d48 : nt!KiProcessExpiredTimerList+0xc6
fffff800`00ba2e60 fffff800`03ce63c7 : fffff800`03e56ec1 fffffa80`005db756 fffffa80`0a449a30 00000000`00000056 : nt!KiTimerExpiration+0x1be
fffff800`00ba2f00 fffff800`03cded15 : 00000000`00000000 fffffa80`0d0e5060 00000000`00000000 fffff880`07449db0 : nt!KiRetireDpcList+0x277
fffff800`00ba2fb0 fffff800`03cdeb2c : 00000000`00000000 00000000`00000000 00000000`00000000 00000000`00000000 : nt!KyRetireDpcList+0x5
fffff880`0c25faa0 00000000`00000000 : 00000000`00000000 00000000`00000000 00000000`00000000 00000000`00000000 : nt!KiDispatchInterruptContinue
STACK_COMMAND: kb
FOLLOWUP_NAME: MachineOwner
FAILURE_BUCKET_ID: X64_0x9F_IMAGE_EtronHub3.sys
BUCKET_ID: X64_0x9F_IMAGE_EtronHub3.sys
Followup: MachineOwner
---------